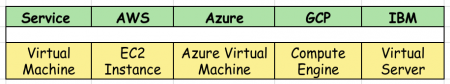
So Grafana is an awesome tool that helps you Query, Visualize and create alerts on those visualizations. End users can create complex monitoring dashboards using interactive query builders. In this blog, we will install it in the AWS EC2 Instance. But the way to install it in a different cloud VM is similar as only the name alone differs as shown below.
Grafana Features:
It’s an open-source tool and so it does have a great community as we can post any kinda questions and the random guy on the internet will definitely answer those questions as soon as possible.
Moreover, it supports all the major databases in the same dashboard.
Based on my personal experience this works well with the time-series database. I found it more helpful.
Steps to install Grafana in EC2 Instance:
Create an EC2 instance with ubuntu / Linux OS
Configure the Security Groups
Install Grafana
Adding Grafana to APT Repository
Start and add AutoStart to Grafana
Logging into Grafana Dashboard
Step 1: Create an EC2 Instance
You can create an EC2 Instance with Ubuntu and grab whatever is free as I did that only.
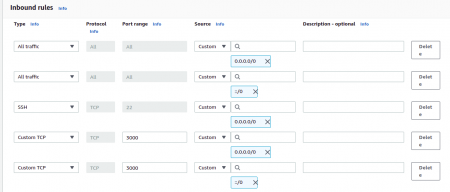
Step 2: Configure Security Groups
Create a security group with open 22 and 3000 port.
22 port → ssh access
3000 port → Access to the Grafana dashboard via a web browser
Step 3: Install Grafana
Always make sure to get the latest version. You can verify that from the following link given below,
Download grafana link: https://grafana.com/grafana/download?platform=linux
code:
sudo apt-get install -y adduser libfontconfig1
sudo wget https://dl.grafana.com/oss/release/grafana_7.5.5_amd64.deb
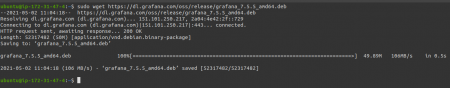
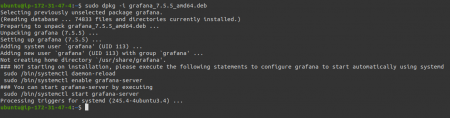
sudo dpkg -i grafana_7.5.5_amd64.deb
Step 4: Adding the Grafana sources to our APT Repository
Note: APT Repository → It’s a collection of deb packages with metadata that is readable by the apt-* family of tools, namely, apt-get. Having the APT Repository will let you perform the package install, removal, upgrade etc (End of Thinking Capacity)…!
we need to modify our /etc/apt/sources.list file by adding a line to the bottom of it.
sudo nano /etc/apt/sources.list
Scroll down all the way to the bottom using your down-arrow key.
Add the following line at the bottom:
deb https://packagecloud.io/grafana/stable/debian/ stretch main
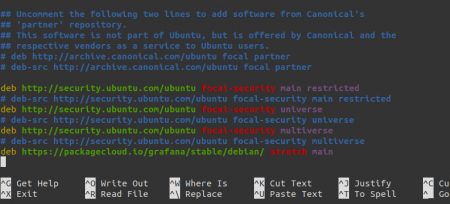
04__adding_grafana_source_repo
Now we need to add the Package Cloud key. This allows us to install signed packages.
curl https://packagecloud.io/gpg.key | sudo apt-key add –
Once you’re done with this we gotta update and verify it once again just to ensure that everything we did went well.
sudo apt-get update
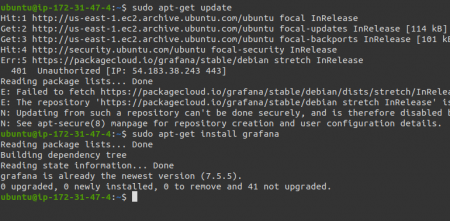
06__install_grafana
Step 5: Starting the Grafana Server and adding it to Autostart
Starting Grafana is kinda simple just start the services as shown below
sudo service grafana-server start
Now we are going to add it to autostart, run:
sudo update-rc.d grafana-server defaults
sudo systemctl enable grafana-server.service
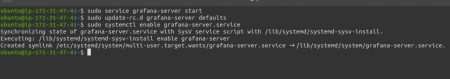
07__adding_autostart
Alright, now it’s time to visualize the output …!!!
Logging in to Grafana
Open up your Web Browser and enter the IP of your server followed by port 3000, like
http://<you IP address>:3000
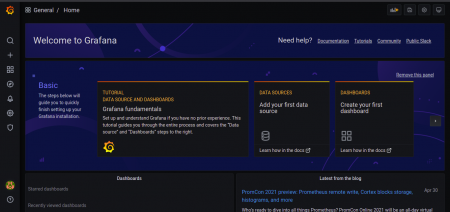
You should then be greeted by the Grafana Login Window.
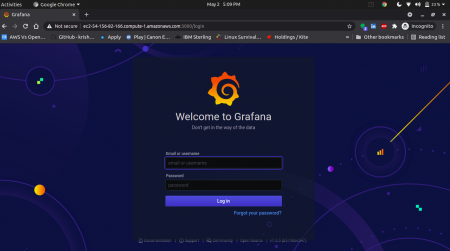
08__finally_grafana_board
Note:
User Name: admin
Password: admin
Once you enter the details you will be prompted to change the User Name and Password, so do it according to your wish

09__new_password_prompt
After this, you will finally visualize the Grafana Dashboard.


Add your comment