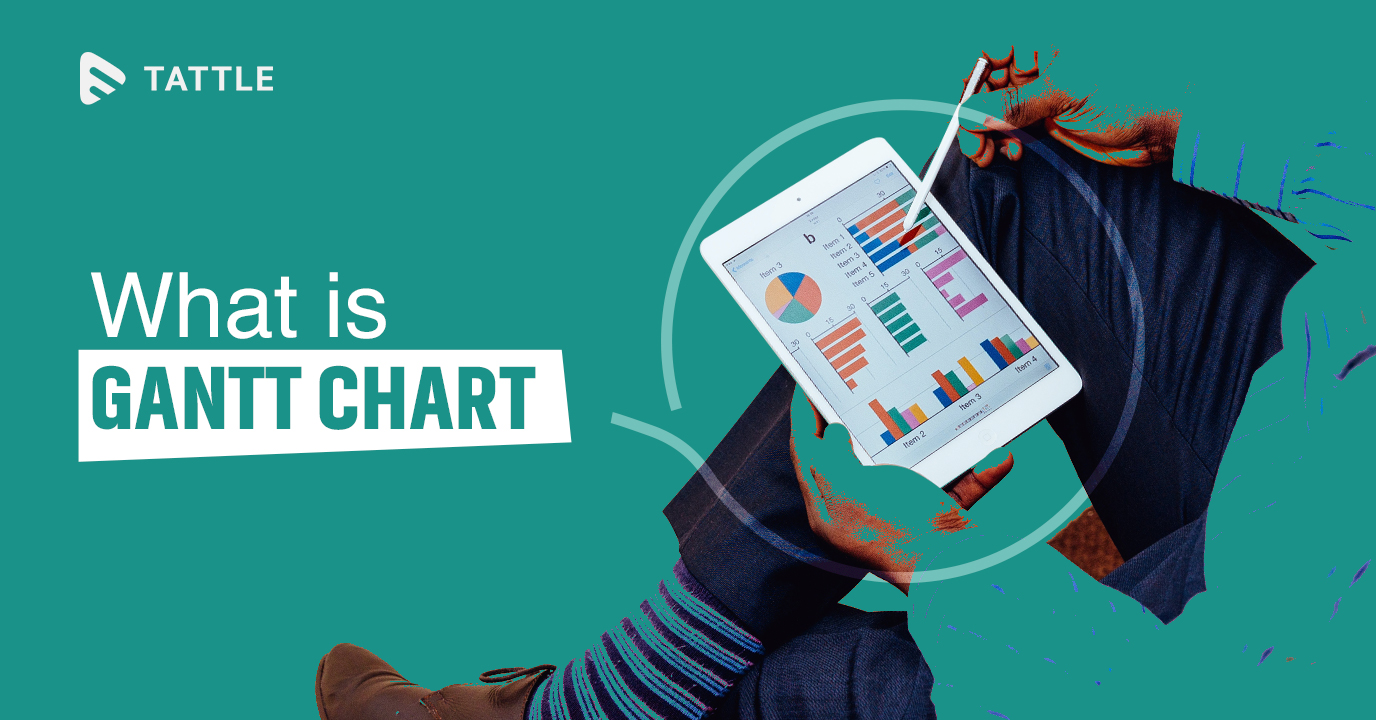
If you are not familiar with a Gantt Chart and are eager to know about it, you are at the right destination. I will help you clear your concept on Gantt blocks, its uses and benefits. Basically, it is a type of horizontal bar chart representation that helps your team to envisage a timeline for a project, program or anything else.
With a Gantt representation, you can visualize your work on a live, automatically updating chart. It not only adjusts according to your team’s changing timelines, but also helps the whole team remain on the same page.
What will we discuss?
- What is a Gantt Chart?
- History of Gantt Chart
- Major Reasons to use one
- Key components
- Benefits of Gantt Chart
What is a Gantt Chart?
It is a horizontal bar chart that represents a schedule of certain activities by the help of the bars. Certain activities may include tasks of a project, events, resource expenditure and many more. The extent and location of each bar display the start date, end date as well as period of each activity. The bars are piled over each other in such a way that you can easily observe at once which project’s activity overlaps another one and for how long. A Gantt chart is a simple representation of different activities that depend upon each other.
If I were to put it in a simple way – it is a graphical representation of activity against time. Gantt charts can be created by hand with a pen and paper, manually built in office suites, or generated using a specialized Gantt chart maker
provided by this tool or its analogues. They represent the fastest and most convenient method. When analyzing project progress or comparing estimated timelines to actual outcomes, a line graph maker can also be useful in visually tracking trends over time.
With a Gantt Chart you can easily see:
- A visual representation of the whole project
- Timeline/deadline of all tasks
- Links and dependencies between the various activities
- Different phases of a project
Managers also get a transparent visibility into the workloads along with availability of any particular team.
History of Gantt Chart
The first Gantt chart was introduced in the year 1890 by Karol Adamiecki. He was a Polish engineer who owned a steelwork in Southern Poland. He was always fascinated about project management ideas and methods and this enthusiasm made him introduce the first ever Gantt Model.
Fifteen years later, an American Engineer and project management consultant – Henry Gantt invented his own version of the chart. His version was widely popular in western countries and this is the major reason for the chart becoming popular with his last name – Gantt.
Initially, Gantt charts were prepared manually by hand. After the changing of each project, the project manager was necessarily redrawing the chart. This limited the usefulness of the Gantt chart.
However, with the advent of technology, smart devices, internet and project management tools, Gantt charts can be effortlessly updated and modified. Nowadays, Gantt charts are most frequently used for tracking project schedules.
A modern Gantt chart shows task dependencies, provides clarity on deadlines, and represents a task with dates laid out horizontally.
Major Reasons to use a Gantt Chart
Create and manage comprehensive projects
It envisages the building blocks of a project and organizes them into smaller, more practicable tasks. These smaller tasks are then scheduled on a timeline, along with the dependencies between tasks, agent, and milestones.
Determine task dependencies
Gantt charts keep an eye on the logistic strategy and planning of a project. Task dependencies make sure that a new task can only get started after the completion of another task. If by chance a task is delayed, the dependency matters are automatically rescheduled. This is especially useful in a multi-team environment.
Scrutiny the progress of a project
Gantt charts help you monitor the progress of your projects and make amendments as per your requirement. It includes release dates, milestones, or other crucial measurements to track your project’s progress.
3 Key components of a Gantt Chart
Date and Time
There are different methods of displaying the date and time of each task. However, it is mostly displayed in days/weeks/months format and while in some instances it can also be represented in minutes or hours.
Tasks or Items
Task of a project is defined as the individual actions that exist at various stages of the project completion. Each task has its own definition and you can also group tasks together to create sub-items.
Owner
Owner is the person liable for creating tasks for different projects. There can be a single or multiple owners.
Benefits of using a Gantt Chart
Agility
Agility is the method of managing a project by breaking it down into several small stages. It helps recapitulate to continuously boost at every stage to deliver the project to the client with utmost efficiency. Gantt charts easily manage different stages of a project with hierarchical linking of several tasks.
Simple-to-understand
Gantt representation helps in easy tracking of critical project information and dependent tasks with the several predefined properties. The chart area evidently visualizes the progress of the project and the timeline helps identify each task’s scheduling.
Clear Communication
Gantt blocks provide clear information about a task. It helps us as well as others to better comprehend how tasks are unfolding and this results in successful accomplishment of the project.
Help Avoid Resource Overload
As we have already discussed above, a Gantt representation helps you schedule work and plan the tasks of a project suitably. It lets you assign, redistribute, and withdraw tasks to and from the resources (staff) and this helps you to easily complete a project without any additional man hour by effectively dividing and assigning time for tasks.
Conclusion
In this blog, I have explained what is Gantt chart, its history, major reasons to use one, 3 key components as well as its benefits. To learn more about the Gantt components as well as its features please feel free to write to us.
Just For Your Information…
We at Muvi also have a similar yet unique tool for efficient project management and automation of every task – Tattle. It is a checklist based workflow management system that helps you build your workflow and attain new levels of efficiency. Just simply integrate, automate and start creating your customized workflows in minutes. Want to take a test ride? Start a 14-day free trial and find out how it’s a complete solution for your business to manage and automate tasks.








Add your comment