Well, everyone’s aware of Public Cloud and Private Cloud. Since it’s 2021 and most of us are working with the help of Cloud Platform. Well, the reason why I am talking about something that is irrelevant is that some people want to monitor both Public and Private clouds using a single tool. Even though in AWS there is something known as Cloud Watch with which we can track everything. Still, when the requirement is like your client is using any Hybrid Cloud or else he wants to visualize the metrics, then the admins can’t directly give access to the Cloud Watch.
Hence there is this one-stop solution for this and it is the Open Source tool Grafana. With Grafana we can connect multiple Cloud applications for monitoring and visualizing it. Moreover, it is easy for the user to edit and Monitor the dashboard according to their needs.
On the other hand, it is an Open Source tool and so we don’t have to invest anything for this.
This monitoring mostly helps us with the cost optimization part, since we can track which of our applications has been used more i.e., which applications or servers are over-specced and so we can think of an alternate way or else downsize or even shut down at certain times.
It is not that Grafana alone can be used, we can also use some other applications like Zabbix. Am not gonna cover details about the list of Open Source tools. Since this blog is based on Grafana. If you’re preparing for certification, you might find Amazon AWS Certification Exam Dumps helpful for practical insights.
For this Tutorial, we assume that you have your Grafana Server installed on AWS EC2.
If not, no worries there is another blog that I wrote about it, kindly have a look at it.
Link: https://www.muvi.com/blogs/install-grafana-on-ec2-and-start-with-an-autostart-for-monitoring.html
3 ways of using Grafana with AWS CloudWatch are as follows,
- With the ARN Number of IAM Policy
- With Credential File
- By entering the Credentials into the Data Source (in Grafana Dashboard)
Here in this blog, we will be doing method 2 i.e. with Credential File
Alright now let’s start with making changes in the IAM …
Note:
Just a small update if you guys are wondering what’s IAM then look below,
What are IAM roles?
IAM roles are a secure way to grant permissions to entities that you trust. Examples of entities include the following:
IAM user in another account
Application code running on an EC2 instance that needs to perform actions on AWS resources.
An AWS service that needs to act on resources in your account to provide its features
Users from a corporate directory who use identity federation with SAML.
IAM roles issue keys that are valid for short durations, making them a more secure way to grant access.
Well if you still don’t get it, then let’s start with it so you may understand it better.
Step 1: Create a new Policy
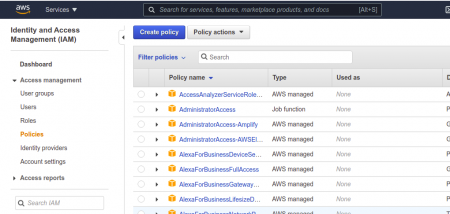
Just follow this, under Services → select IAM → Policies → Create Policy
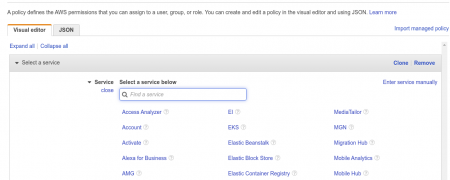
Now under the services → Cloud Watch
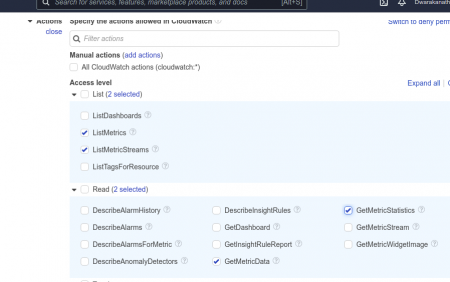
After that, do select the following Access Level Policies for which we can get the metrics to report in Grafana. Then Review your Policy, give a name to your policy and describe what this policy contains so that when we have a look at it in the future we will be aware of what are the features this policy has. This is just to make our job easier.
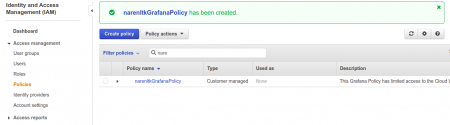
Once you’re done with it, you have to verify whether what did has been created or not, just to cross-check that is all.
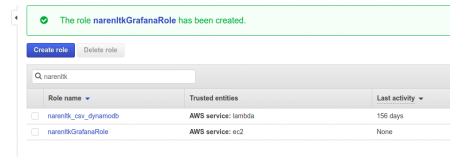
Step 2: Creating a Role
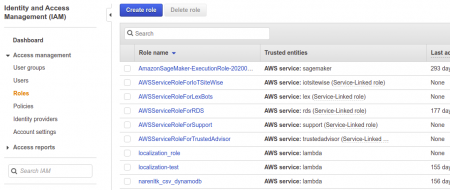
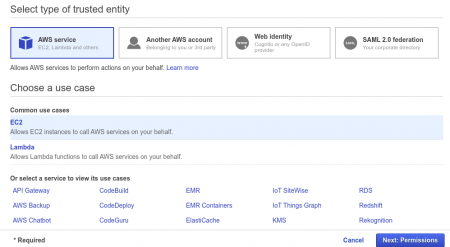
Just follow this, under Services → select IAM → Roles → Create Role
Now select AWS Service → EC2 (under common use case) → next: Permission
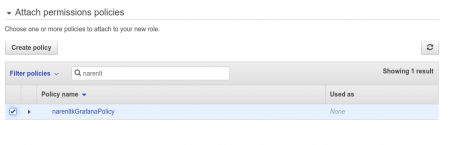
Alright now we have to attach the policy which we created earlier with this Role, as shown below,
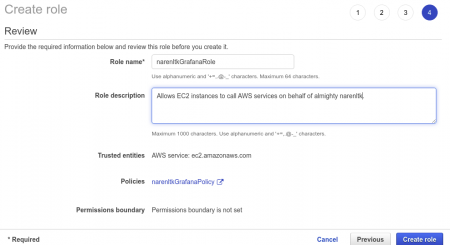
Once the Policy has been attached we gotta review it, where ought to update the Role Name and Description etc.. and once we are done with this we can select Create Role.
Once that is done we need to verify whether the role which we created is there or not,
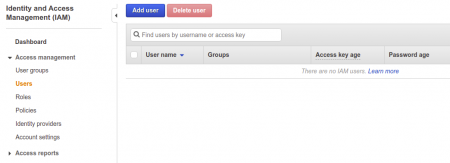
Step 3: Creating a User
First, we have created the Policy then Role, and then attached the Policy with the Role and now we are creating the User so that we can attach it to the EC2 Instance.
Now select the Add User.
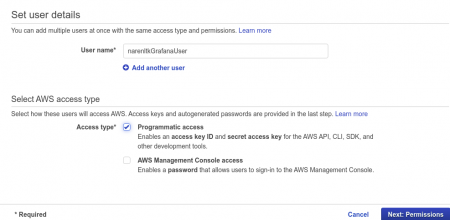
Give the user name.
Kindly make sure that you select the programmatic access in the Access Types under select AWS access type. Which will give you the details of the Access Key and Secret Key. Make sure that you make a note of it as it will be generated only once and if you forget it then you need to create it again.
Then select Next Permission.
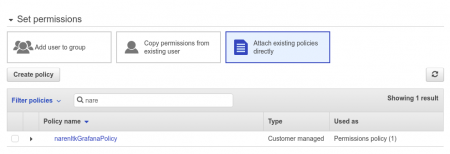
Now Set Permission, if you have already created any group means select add user to group or else proceed with Attach existing policies directly → search for the Policy which we created in the last step and proceed.
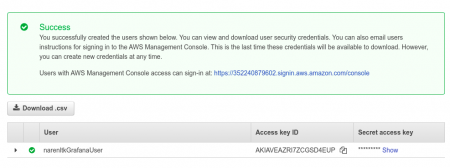
Now here you can see the Access Key ID and Secret access key, which I was talking about earlier.
Yeah, you have to save it since it will be displayed only once just like the proverb “The Golden Words are not repeated”.
I guess now we are all set to go…. Now all that’s left is just attach the User with the EC2 instance which we have.
Step 4: Attach the User to EC2 Instance
Here I do expect you all to have your EC2 instance ready i.e. it should have been started.
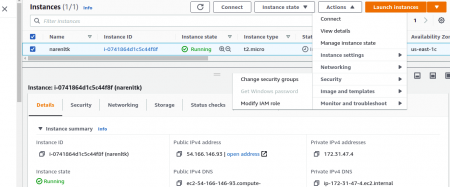
Now select the instance for which you wanted to update the IAM User and click on
Action → Security → Modify IAM Role. (This is the latest since AWS has been keeping on updating)
If you have been referring to the Old videos on Youtube or else some old Medium Blogs then you would have been navigated to
Action → Instance Settings → Attach / Replace IAM Role.
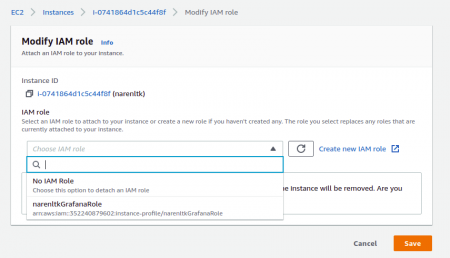
Now you gotta search for the Role which you have created and select that and save it.
Now you ought to verify that too, so kindly check the security group settings of the EC2 instance as shown below,
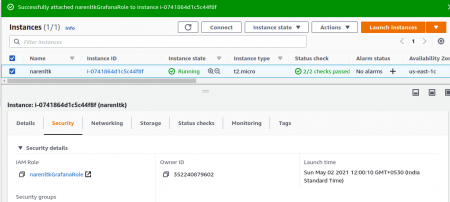
You can verify the IAM Role that is attached to the Security Group.
Now we are gonna attach the Credential file to the EC2 Instance
Step 5: Creating a Credentials File
Now log into your EC2 instance to which you have attached the IAM Role in the previous step and do the following as shown below.
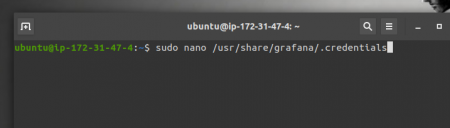
Here the code is as follows,
sudo nano /usr/share/grafana/.credentials
We are creating the Credentials file for our grafana to access with the Access ID and Secret Key which we created in the previous step.
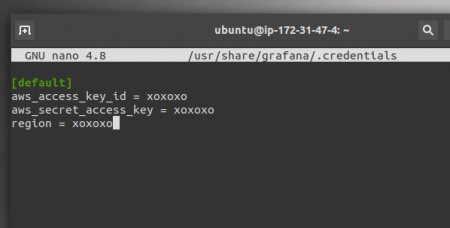
Replace the “ xoxoxo “ with your own access key id and secret key and region.
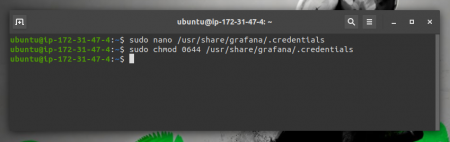
Save this and now we are going to give this the permission to access it.
The code is as shown below,
sudo chmod 0644 /usr/share/grafana/.credentials
Step 6: Configure Grafana with AWS Cloud Watch
Now log into to your Grafana Dashboard, with uname and pwd which you have configured,
Note:
Default username and password is given below
Username → admin
Pwd → admin
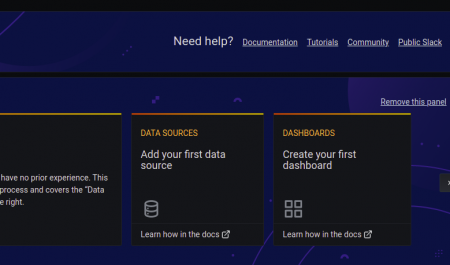
Here you ought to see a dashboard panel like shown above and kindly select the Data Source, i.e Add your first data source.
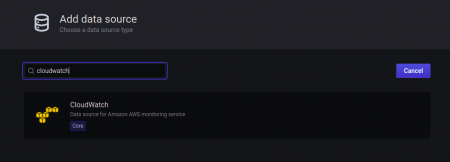
Now search for the CloudWatch in the search bar, then select it to configure the credential details.
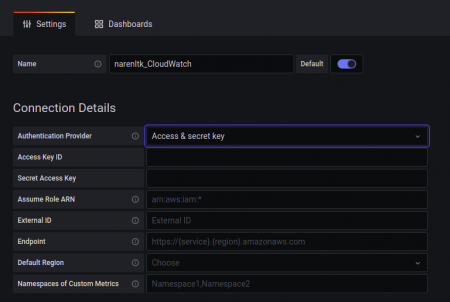
Here you gotta give your desired name, then under Authentication Provider select the Access & Secret Key.
Now given the details of the Access Key and Secret Access Key alone with the Default Region.
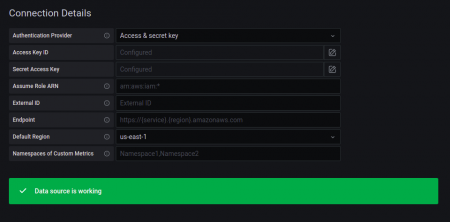
Then click on Save and Test and you should get the following as the output.
If in any place you find any error which you wanna track then, go to the EC2 instance Terminal and give the following command to check the log reports,
cd /var/log/grafana/
ls
vi grafana.log / nano grafana.log
This will give you all the details of the error which you have faced.
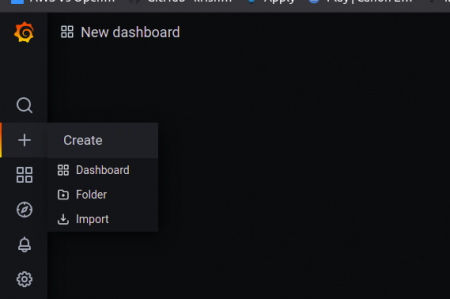
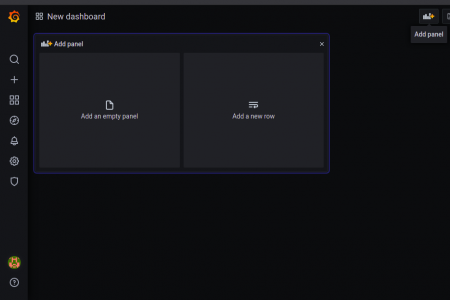
Step 7: Create your beautiful Dashboard
Now you need to select the + → Dashboard
Now you can either select the Add Panel in the top right corner as sometimes panel will be created created with Add Empty Panel and Add Row as shown below.
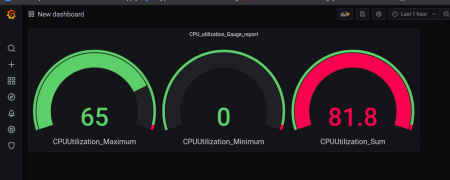
Then all the grafana query I will let you guys do it since it is easy though.
Here I have done an example with the CPU Utilizations.


Add your comment