Analytics and Reports

Analyze Content Performance
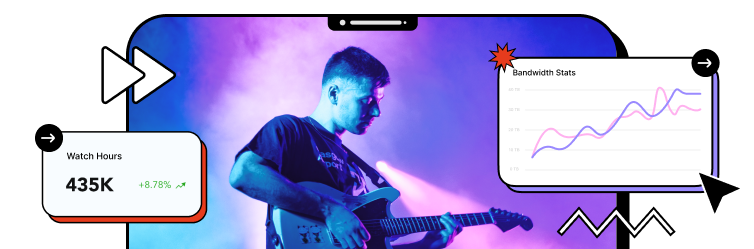
Link your platform to Google Analytics and measure your platform’s performance on the go. Track your users on a daily basis. Get reports on which content is performing and which is not, which page of your website has got the most appeal, gauge your click-through-rate etc. Analyze and formulate your content strategy accordingly to get the best out of your streaming channel.
Define What Counts As a View
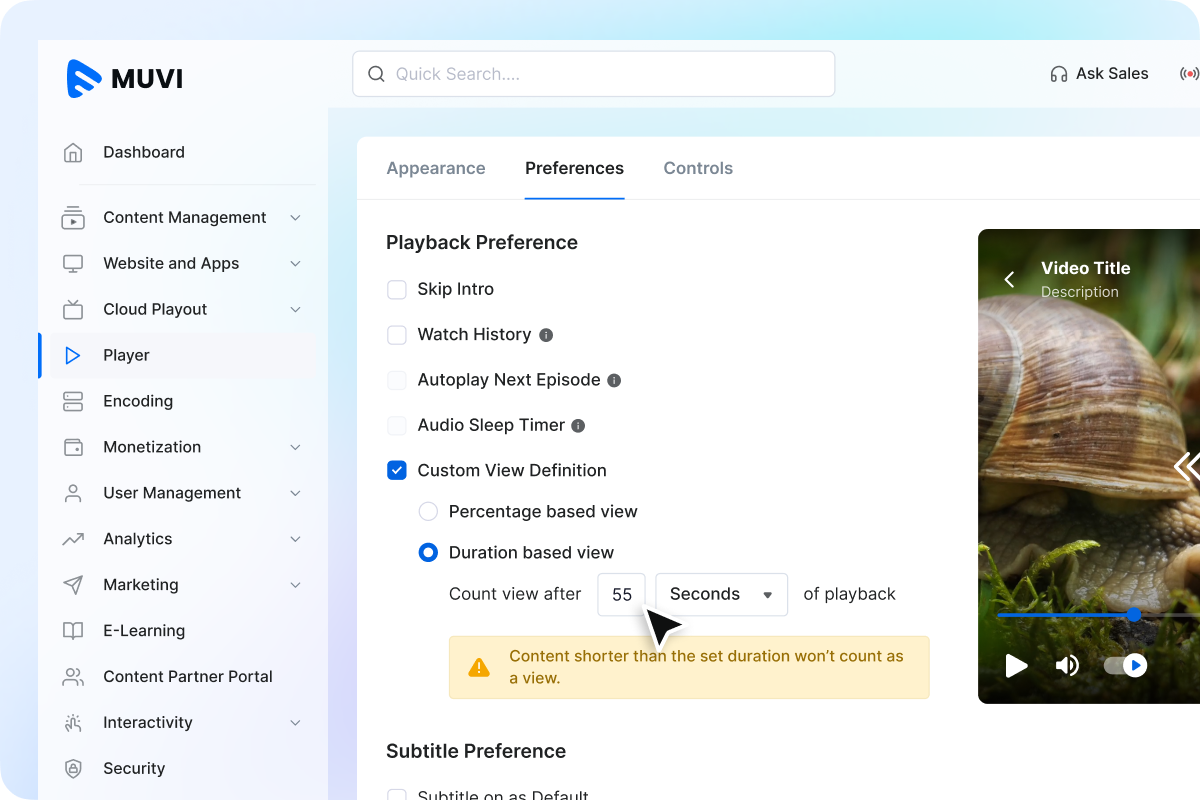
Not all views are equal. Define what counts as a view on your platform. Set custom rules for when a view is recorded, whether it's after 10 seconds or 25% watch time.
Use it to:
- Measure real engagement
- Control playback based on valid views
- Enable accurate revenue sharing
- Avoid inflated metrics
Understand User Behavior
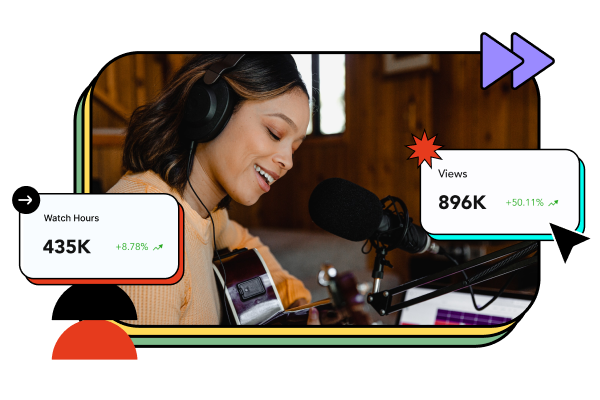
Track and understand actions like content views and watch duration with segmented data analysis by content, user, device type, and geography. Gain valuable information about audience preferences, popular content, user engagement, and geographical reach. Understand viewing patterns, optimize content strategy, and enhance user experiences to maximize your streaming success.
The Right View for Your Data
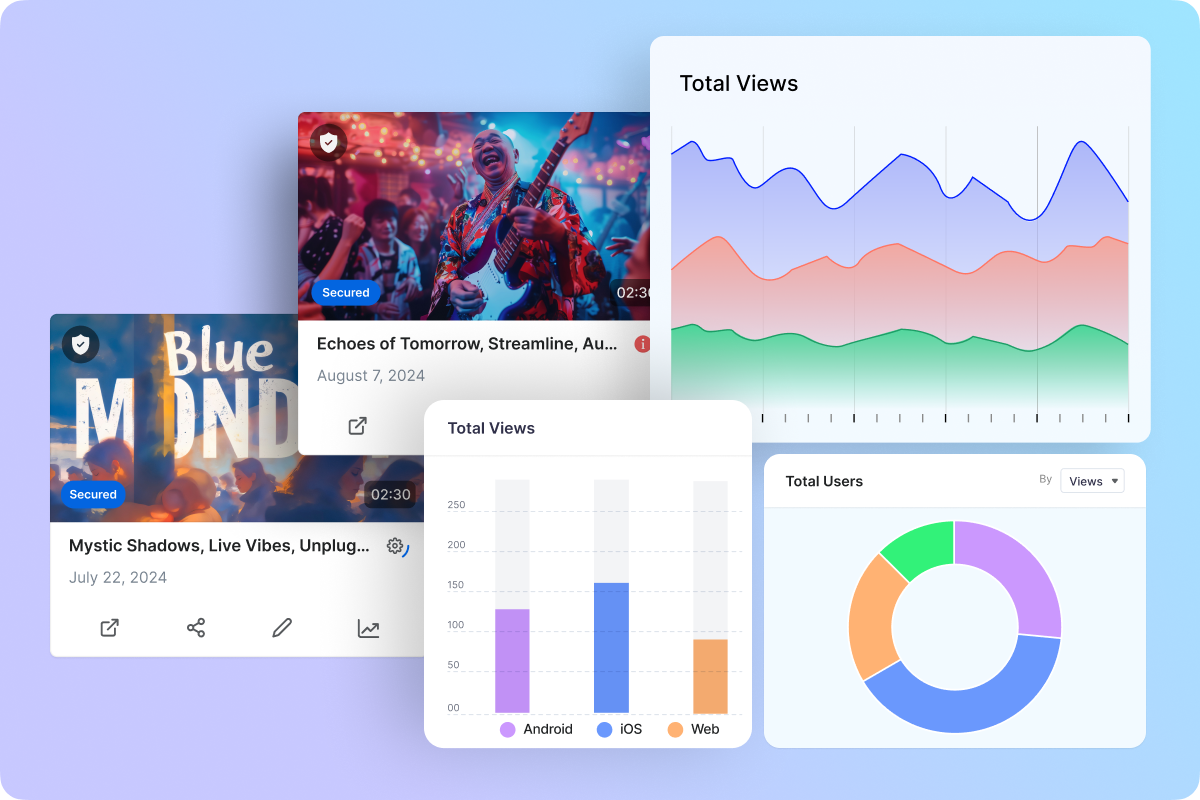
Choose the chart that best fits your data, whether you're tracking trends, comparing categories, or understanding audience distribution.
- Line Chart: Track trends over time, such as watch time or revenue
- Bar Chart: Compare values across categories, such as devices or content
- Column Chart: Compare values across time-bound segments, such as weekly views
- Pie Chart: See how a total is distributed, such as viewership by genre
- Area Chart: Track trends while showing overall volume, such as total watch hours
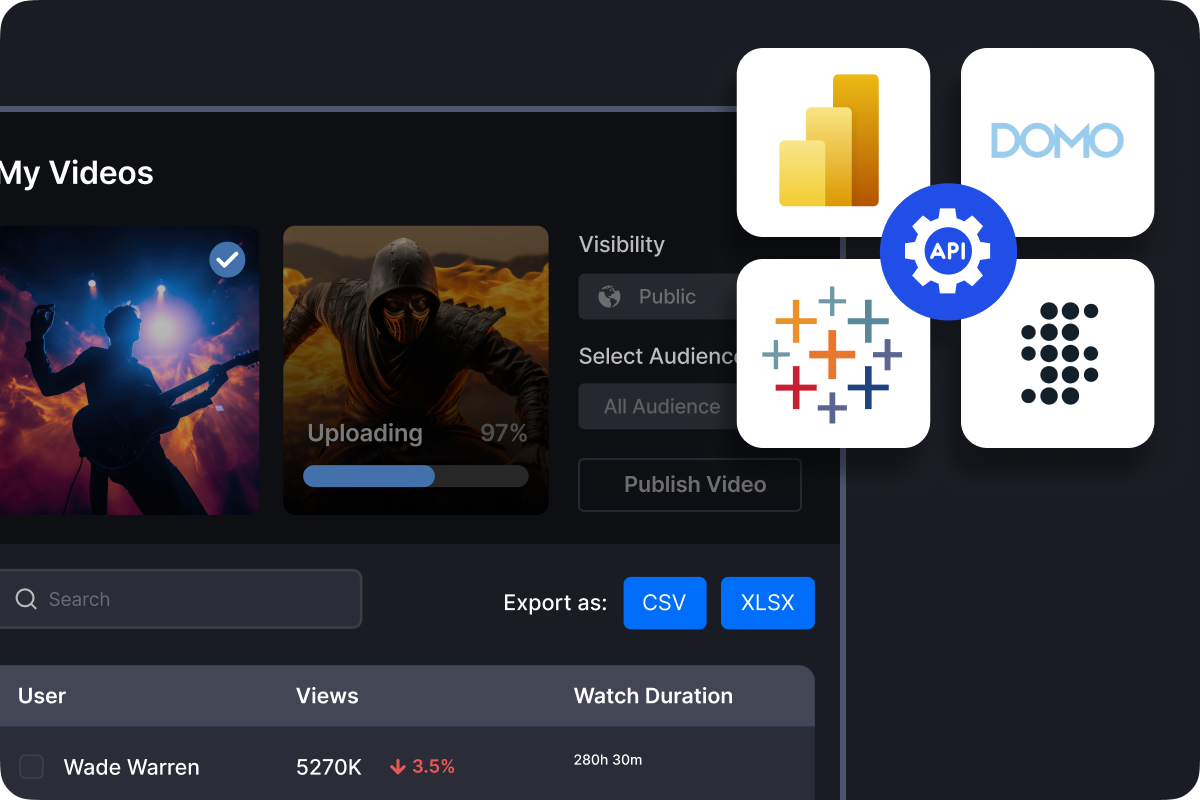
Easily Integrate with BI Tools
Seamlessly connect your BI tools with our robust APIs. You can also export data and reports as CSV or XLSX files from Muvi Flex and import them into your BI tools to generate comprehensive reports.
- Analyse costs and storage utilisation
- Monitor asset lifecycle
- Track API usage and integration health

Start your 14 day free trial today
- Extensive analytics and reporting
- Powerful content management
- Manage video content from single panel
Upgrade / Cancel Anytime. No Commitments.
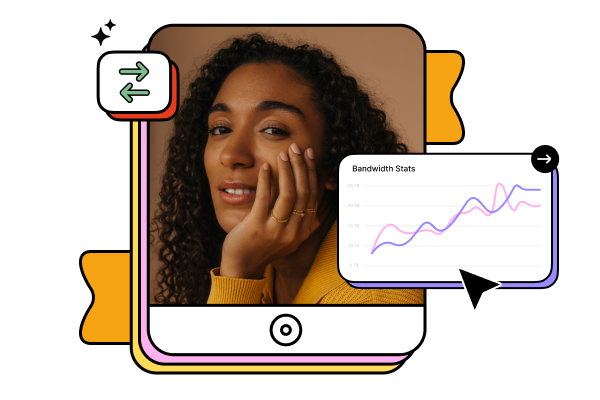
Content and Bandwidth Stats
Each content performs differently and consumes a certain amount of bandwidth depending upon various factors such as device used for streaming, geography and content quality. Knowing which content is driving maximum views or is on the higher level of bandwidth consumption helps platform owners improve content quality providing a richer user experience and plan a better revenue strategy for the platform.

Information on User's Devices
In the era of multi-devices and multi-screens, it is very difficult to understand what kind of device or platform a user prefers to consume content. With Muvi Flex’s analytics and reports, you get detailed information of the user's device and browser used to stream a video or audio content from your library.