Are you a Linux developer? Then, you must be familiar with tools like nmon, right? But for those unversed, nmon is a fully interactive performance monitoring command-line utility tool for Linux. In more simple words, it is a benchmark tool that displays the performance of the CPU, Memory, Network, Disk, File System, NFS, Top Processes, Resources, and Power Micro-Partition.
The screenshots given below will help you in understanding the different functionalities of the tool more clearly.
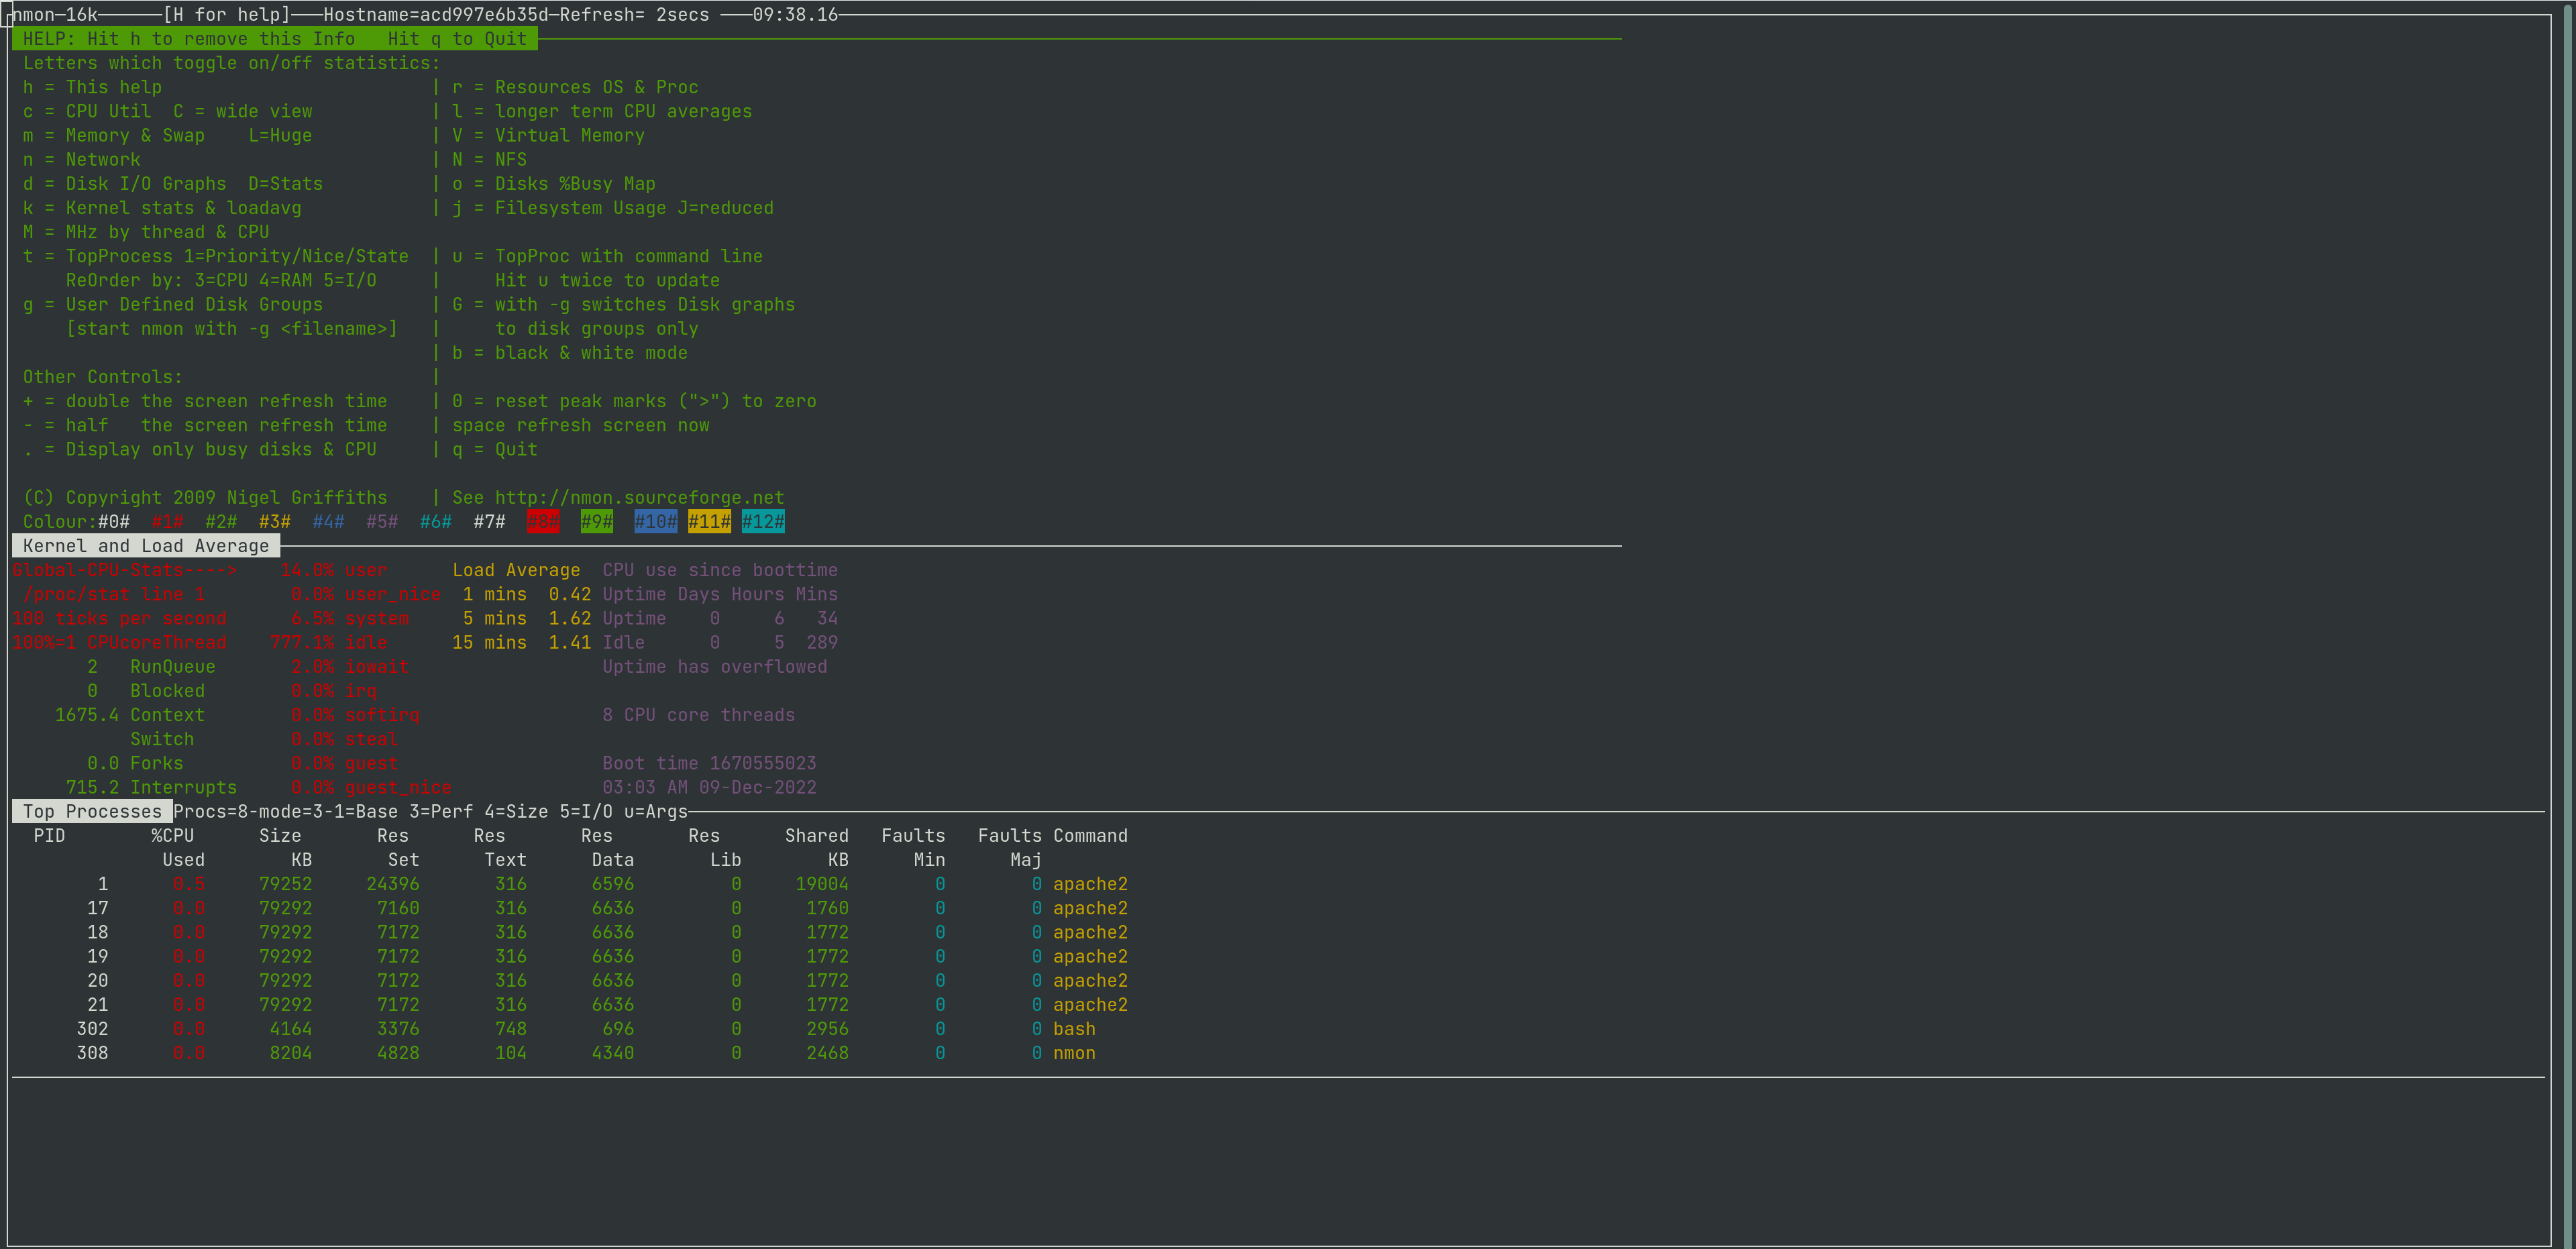
This is how nmon shows you the kernel and load averages
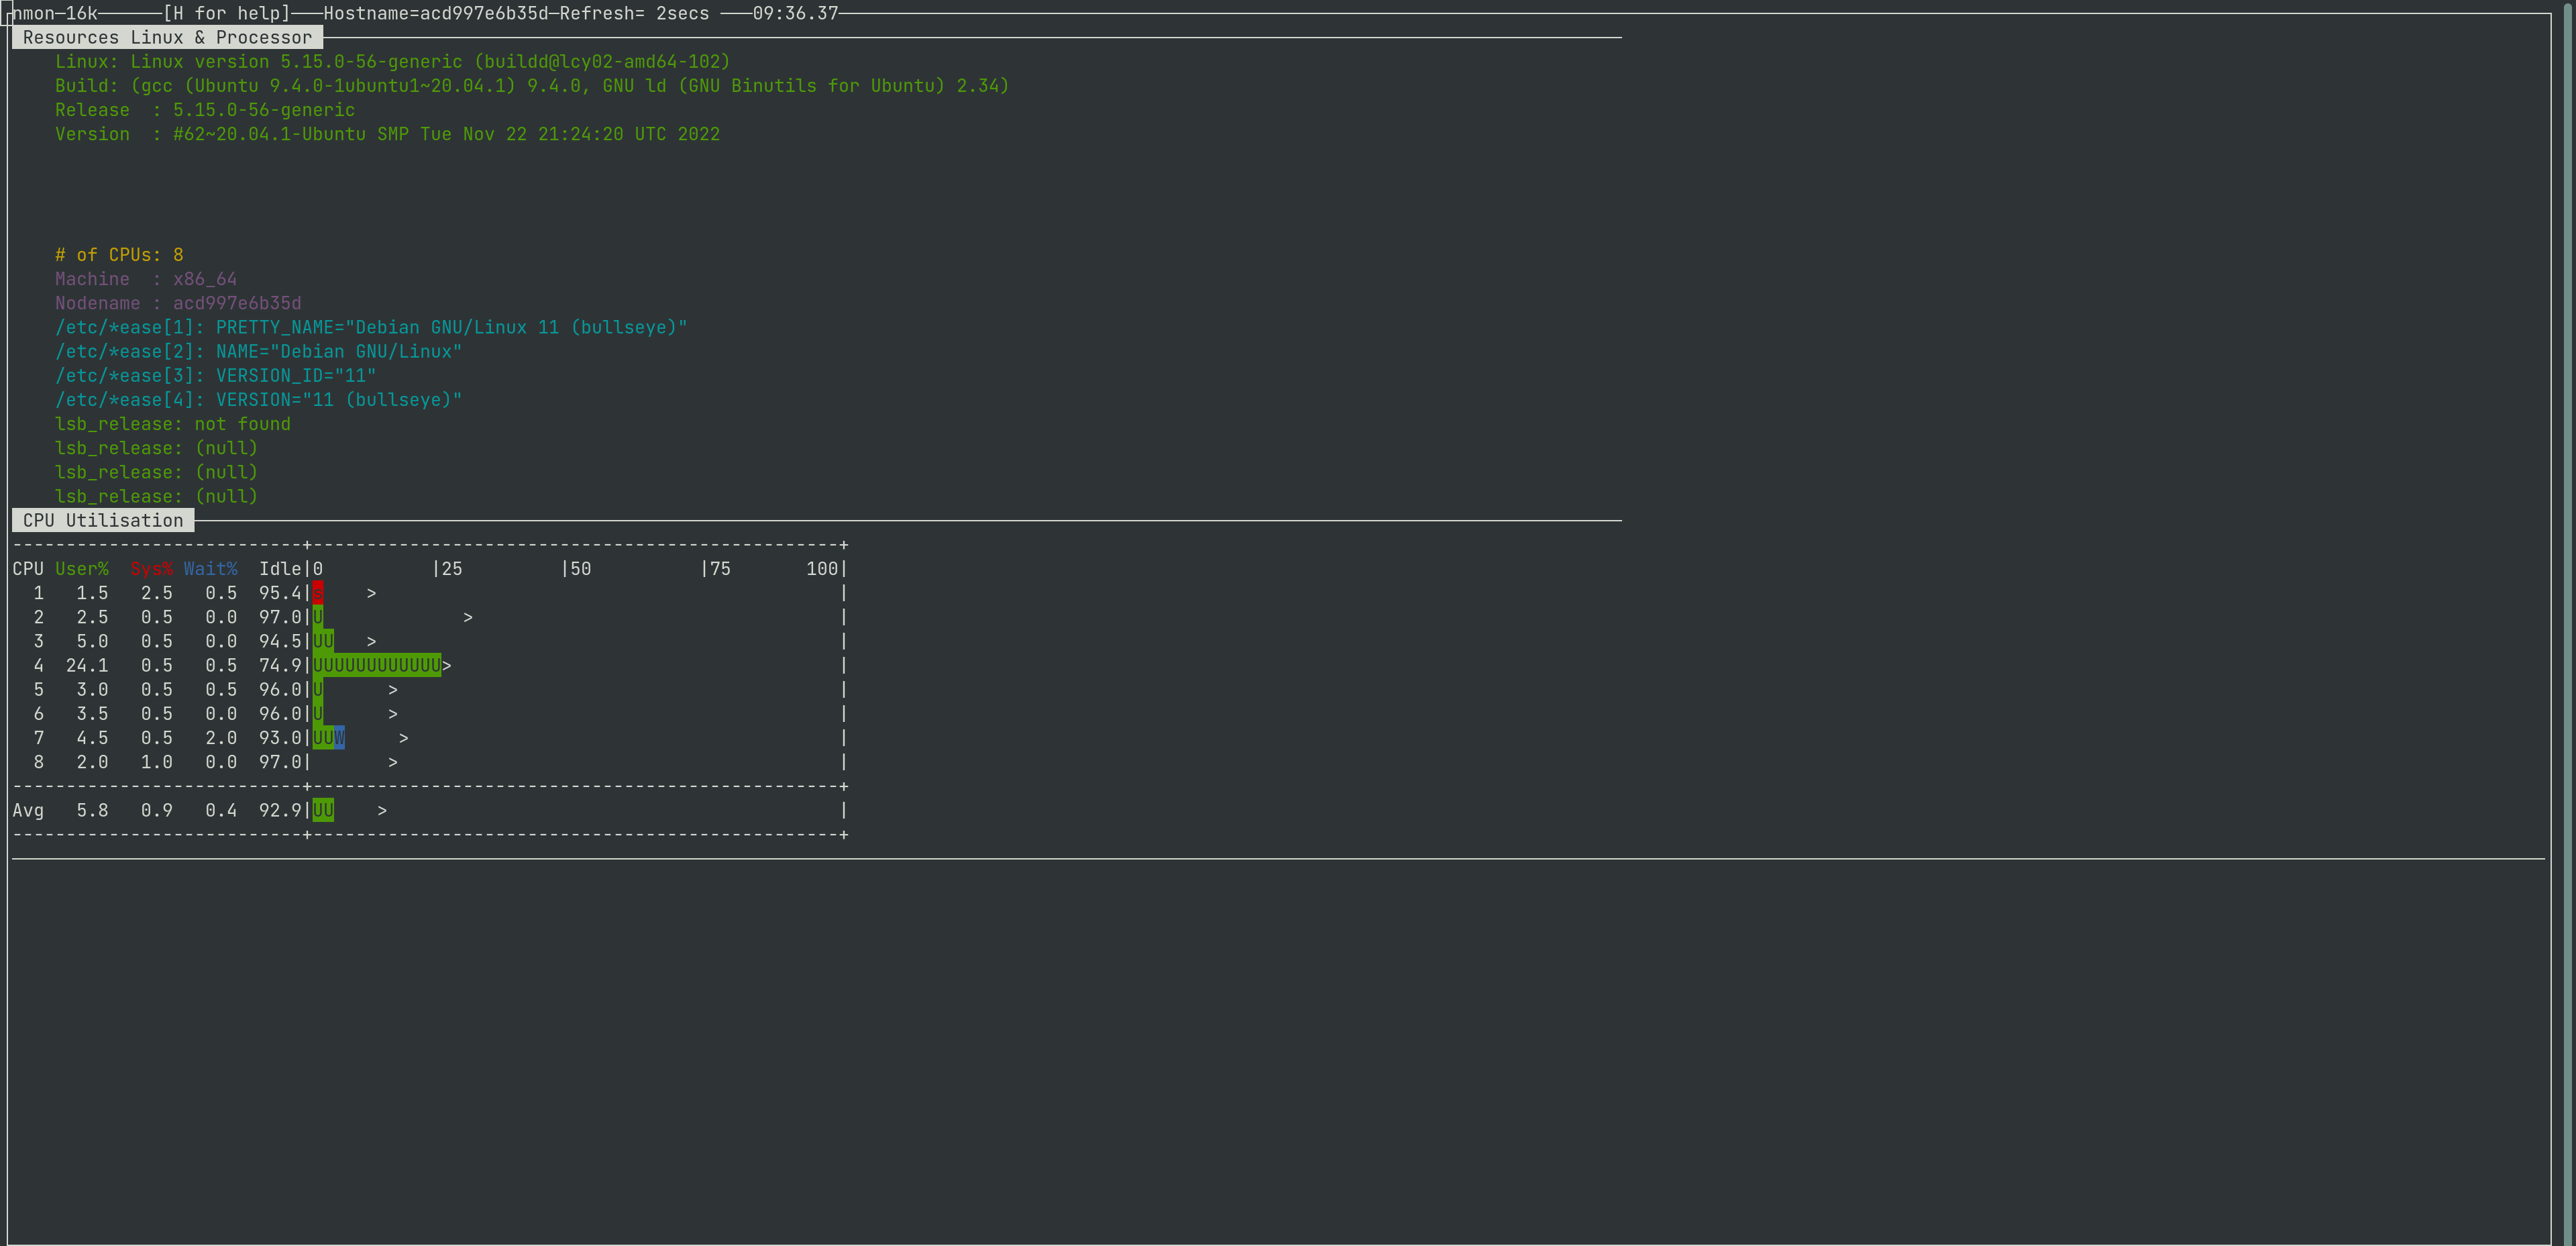
This is how nmon show you the resources and processes
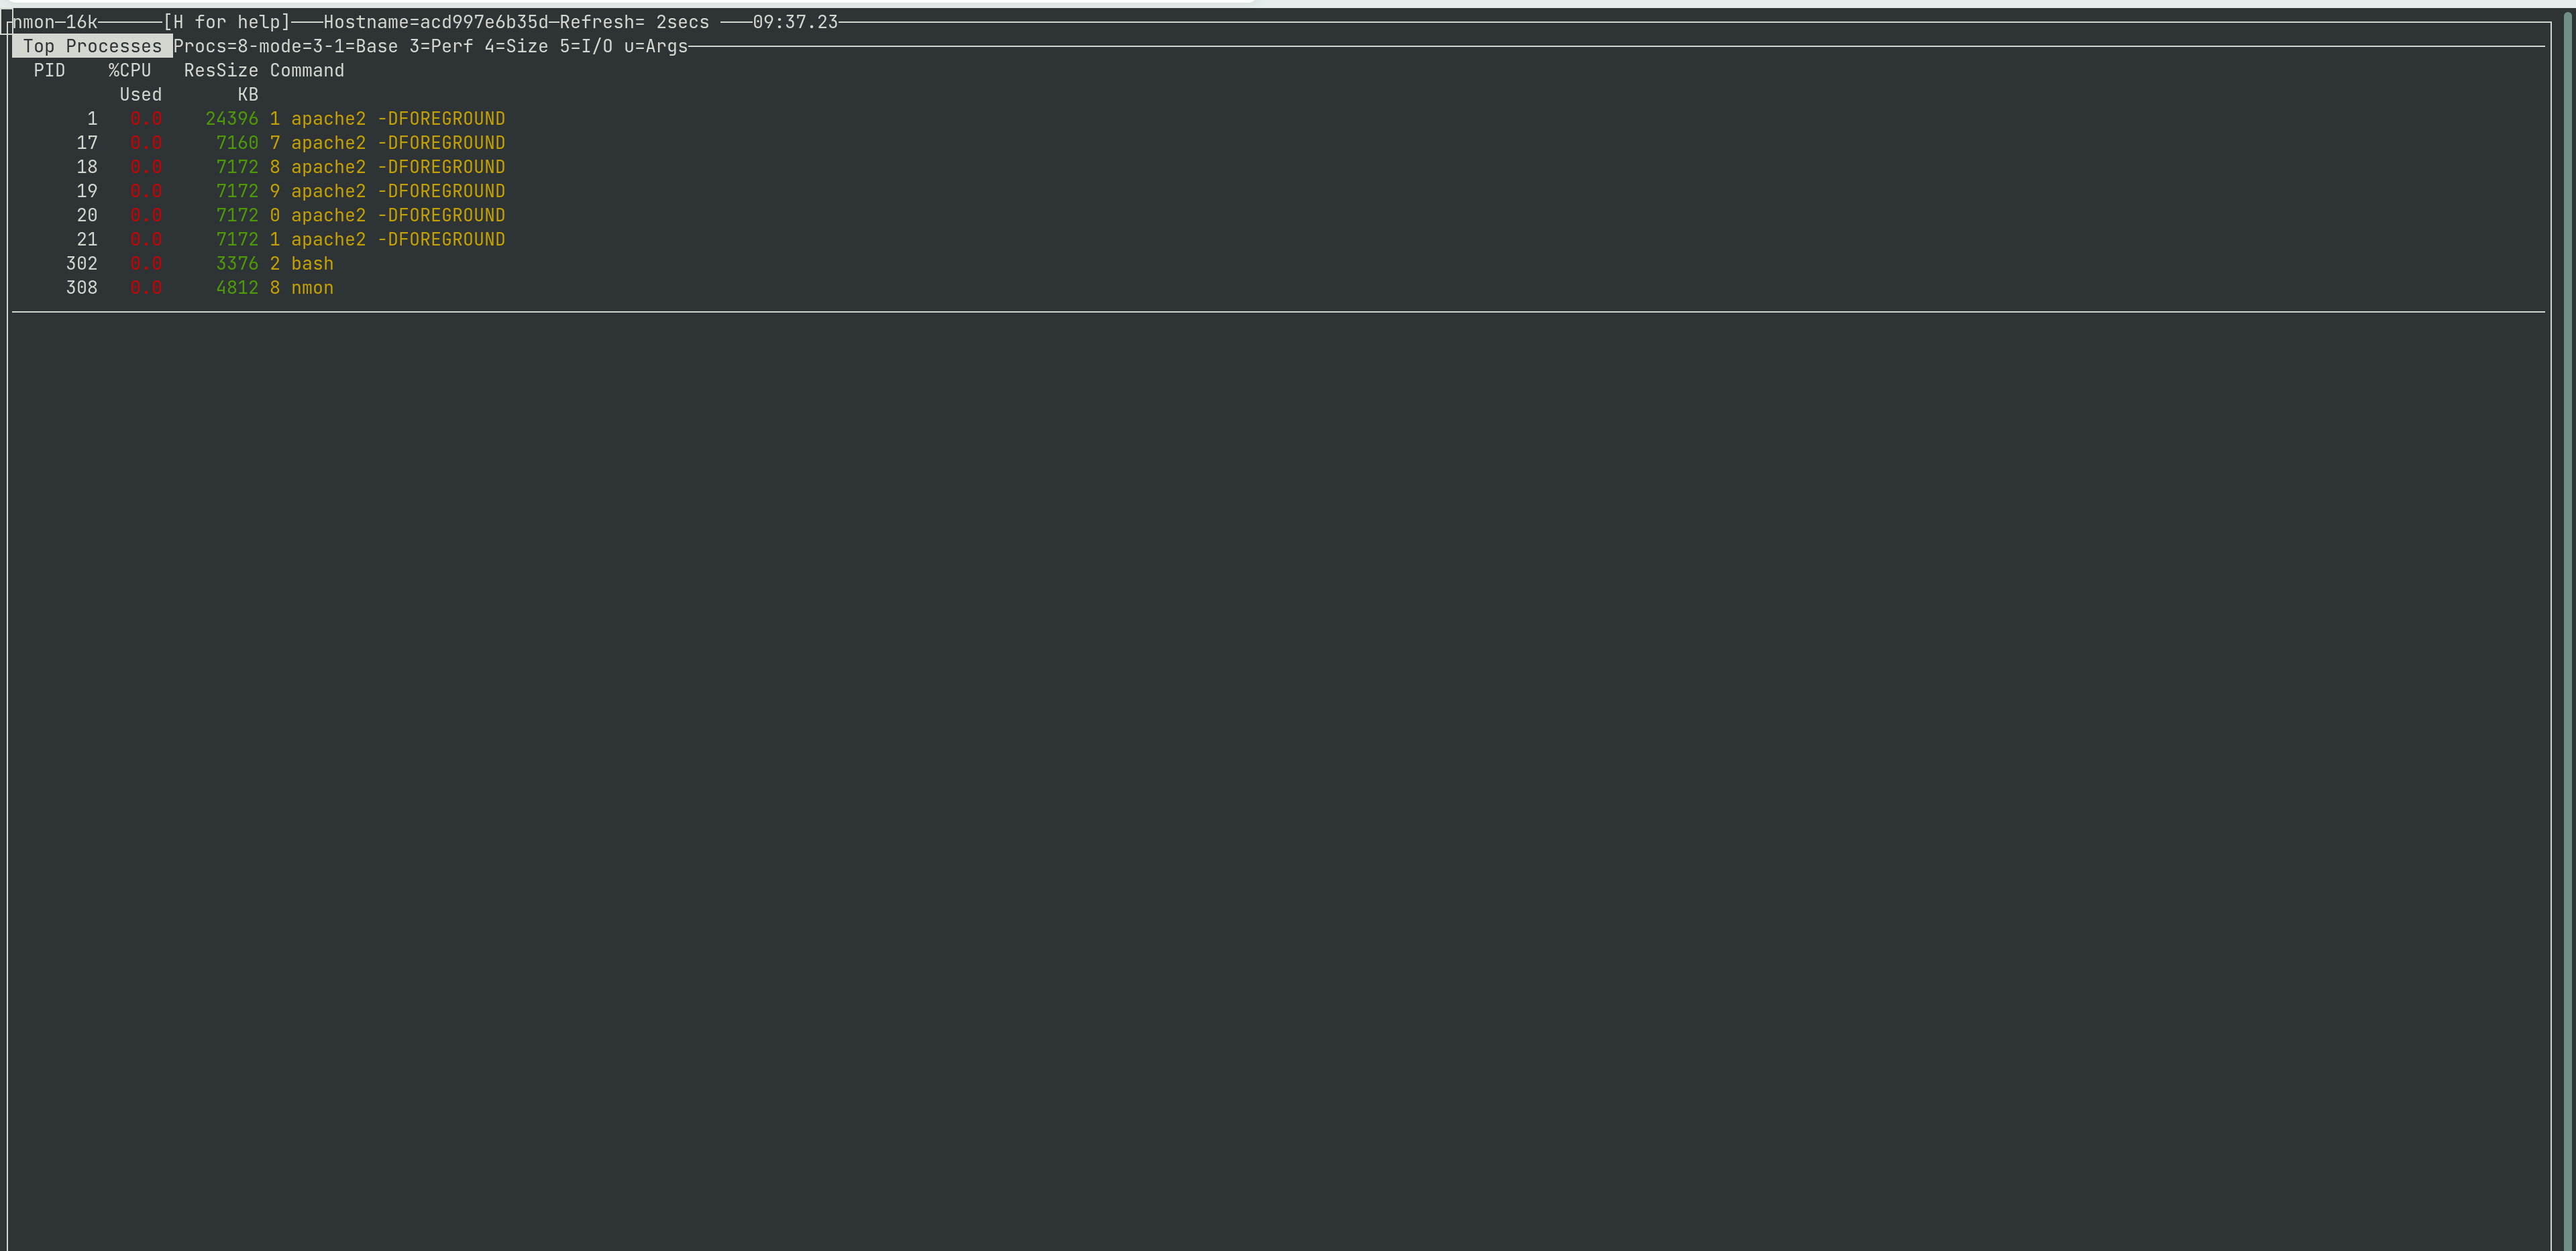
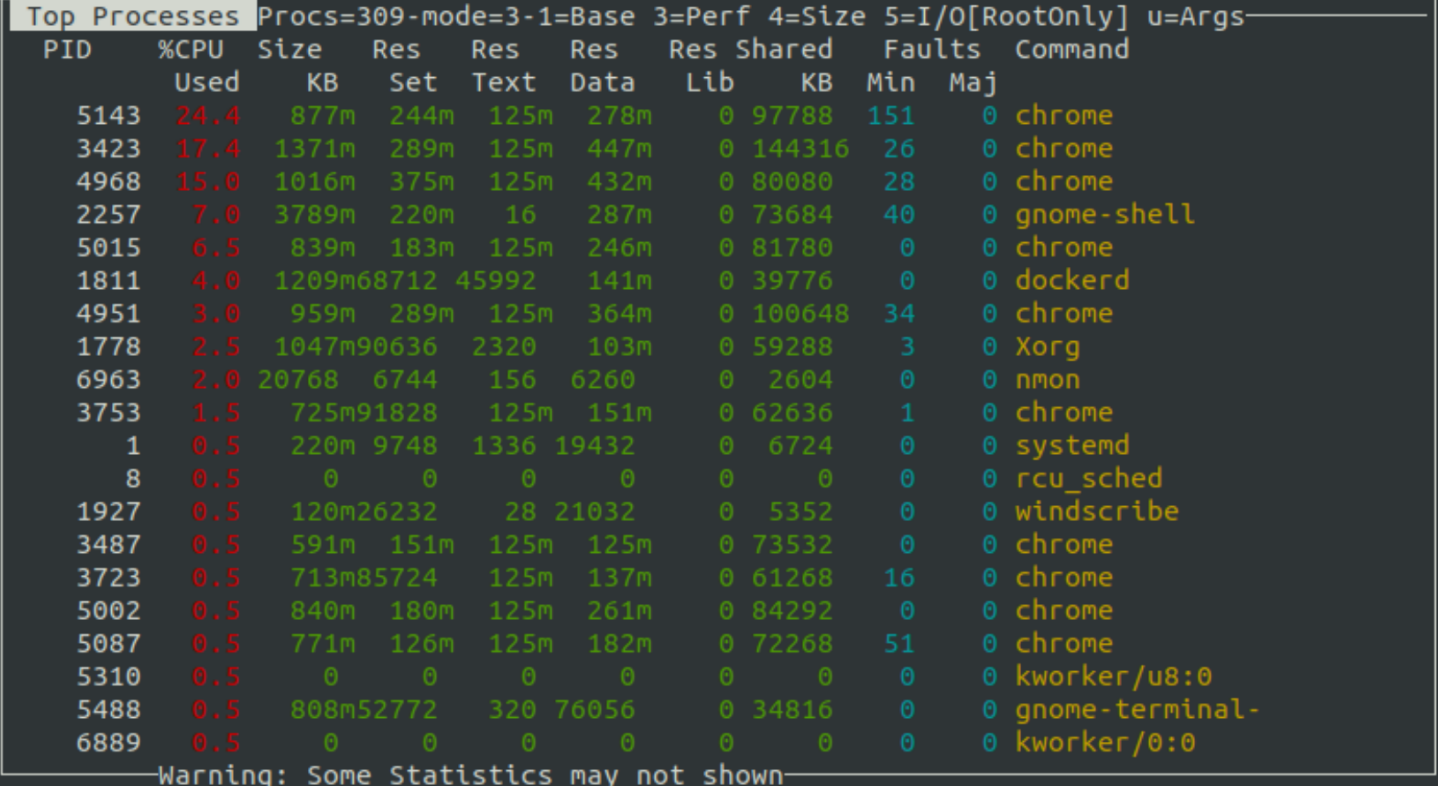
This is how nmon shows you the top-running processes
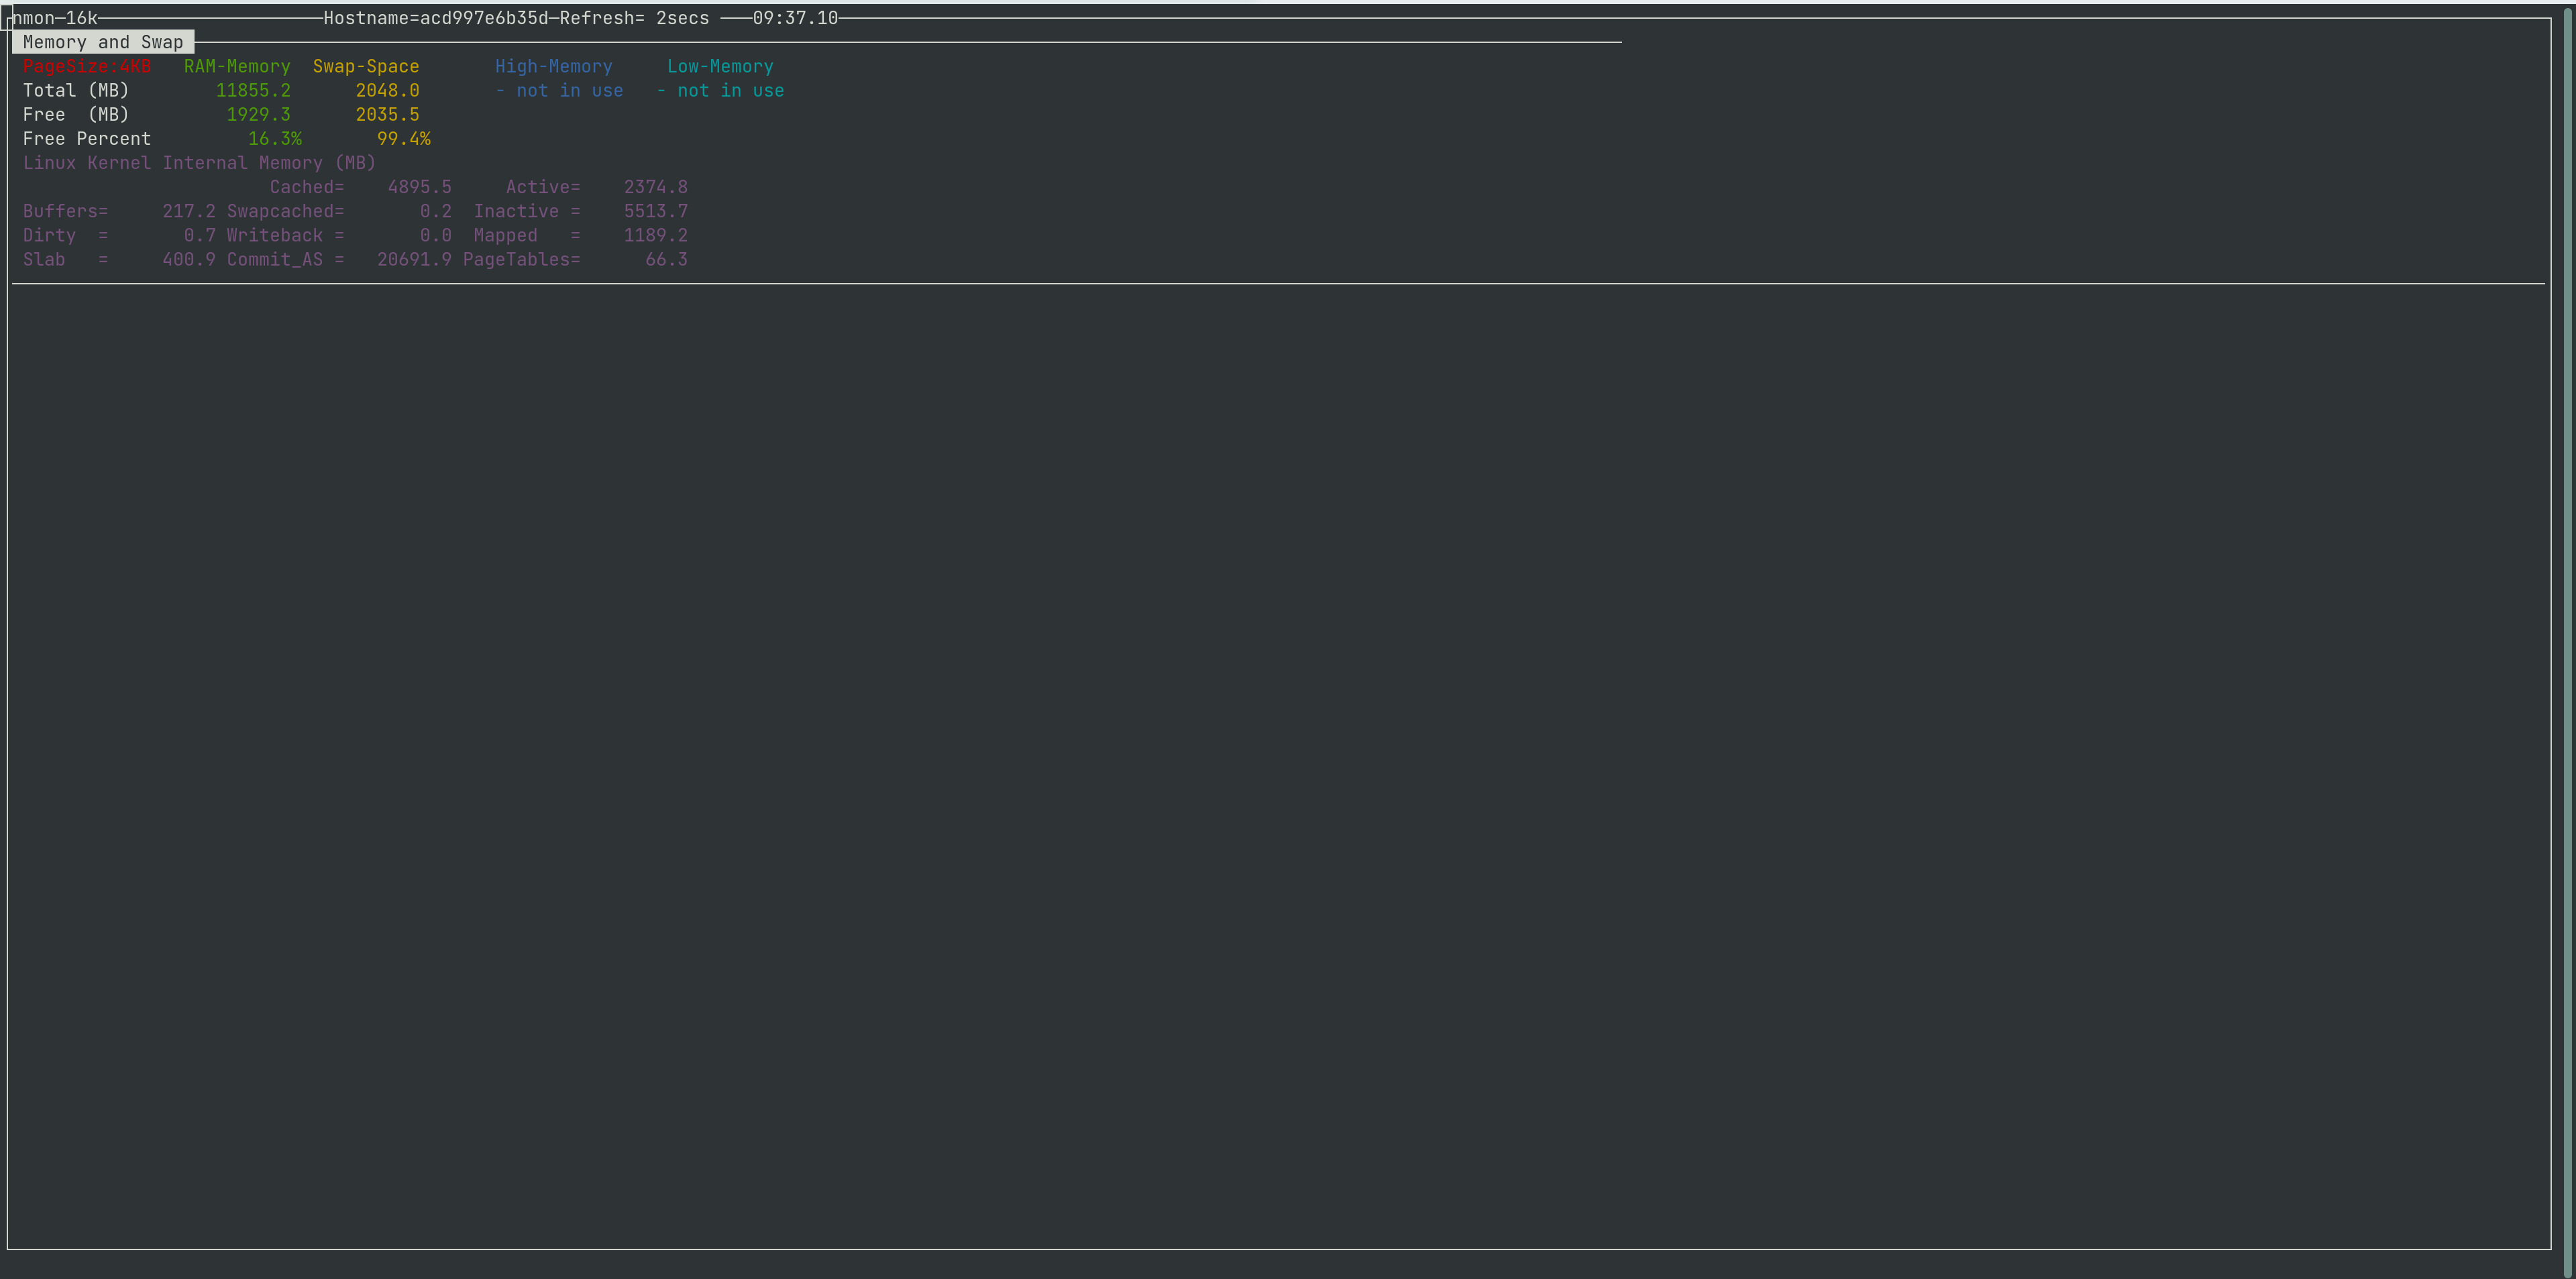
This is how nmon show you the memory and swap
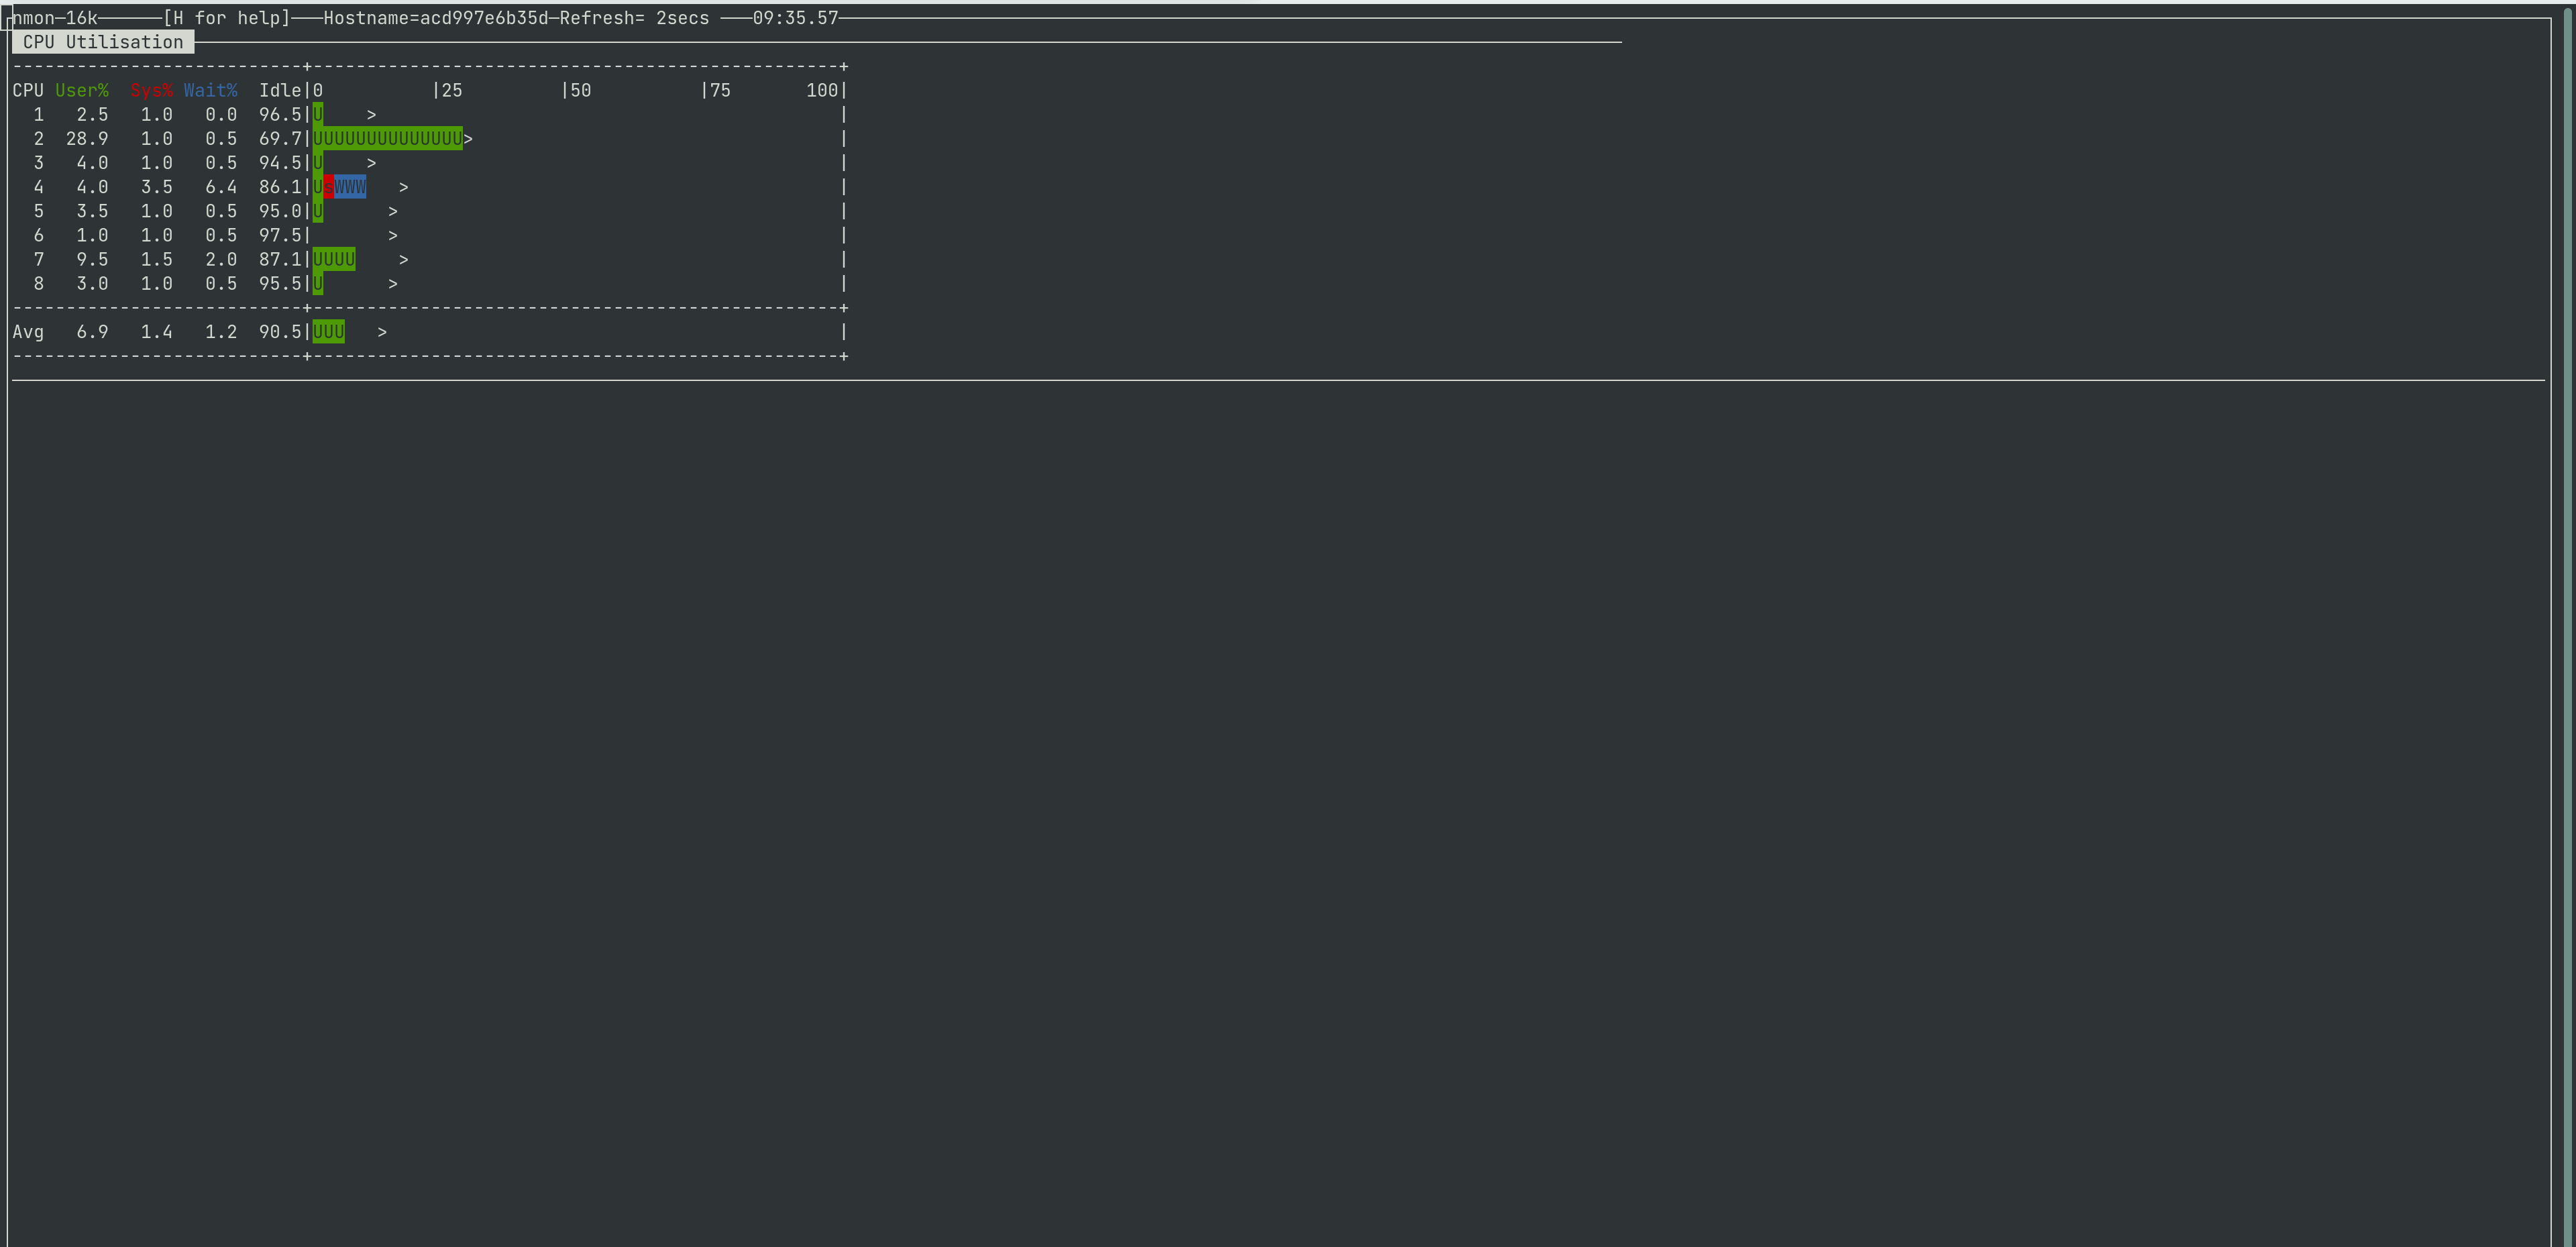
This is how nmon show you the CPU utilization
So, in simple terms, you can say that it is a GUI benchmarking tool for Linux CLI. And it is one of the most commonly-used tools used by any Linux developer nowadays. If you are also a Linux developer looking to get started with a GUI-Monitoring tool, So, let’s take a look at some of their applications.
Where Are GUI Benchmarking Tools Used?
Basically, if you work on CLI in Linux most of the time, you will need to observe the CPU and RAM stats. And if you want to Observe the CPU and RAM statistics on the go, then GUI Benchmarking tools are your best friend. With this tool, you can see all the CPU and RAM performance stats in real time over the terminal window.
And the installation process is also very simple. You just need to follow the steps given below.
How to Install These Tools?
You can install it on Ubuntu with the below command:
sudo apt-get update sudo apt-get install nmon |
On the other hand, it can be installed on Fedora using the command given below:
And if you want to install it on RHEL, you can follow the commands given below:
# yum install epel-release
# yum install nmon |
How to Get Started With ‘nmon’?
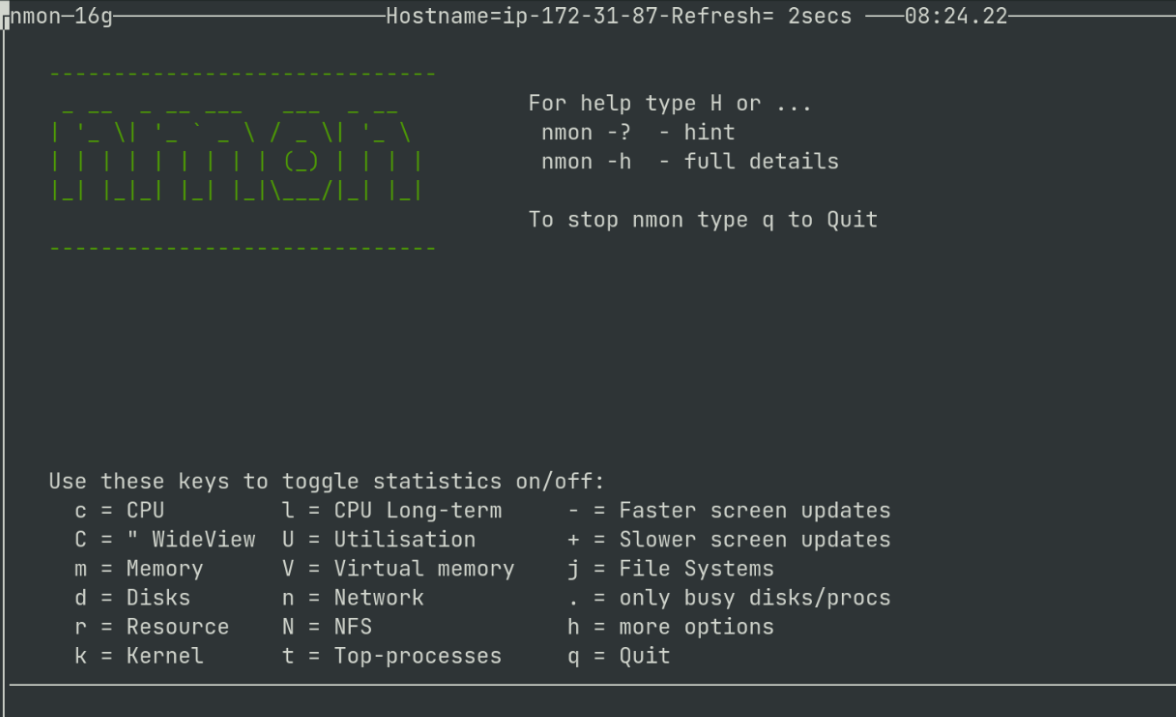
To start ‘nmon’ in the terminal window, open the terminal and just write “nmon” and hit enter. After this, you will get a window as shown in the screenshot below.
Now, if you hit “c” and “m” then you can see the Live performance of CPU and Memory, like the screenshot shown below.
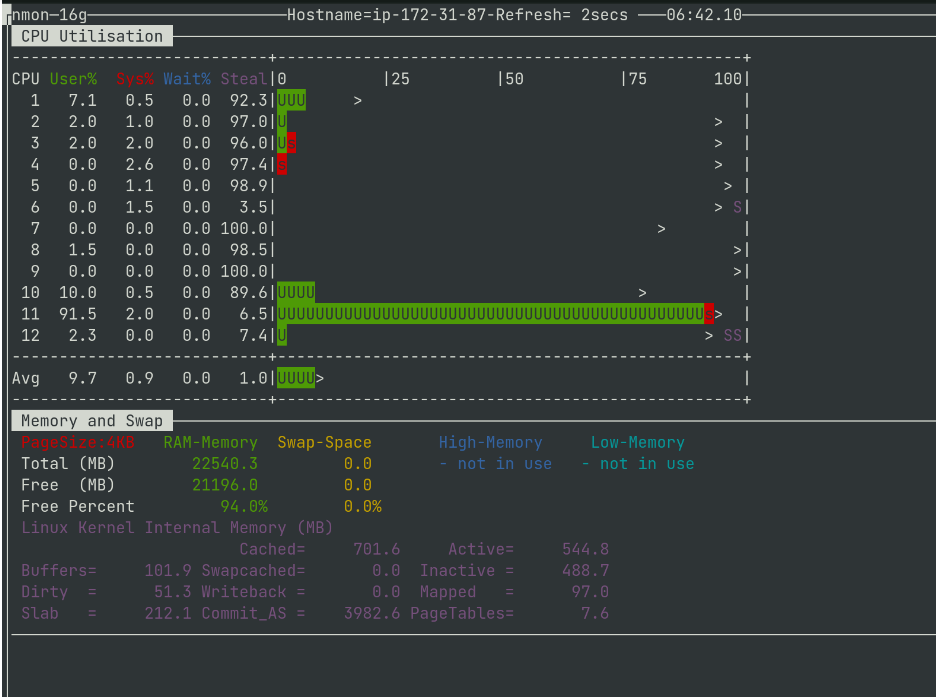
And when you want to exit from this window, just hit a “q”. So, as you can clearly see, the process is very easy and simple.
Expert Tip: When I work with an AWS EC2 instance, I open this ‘nmon’ in one tab, and keep working on the other terminal on the other. Through this, I can observe live performances on the go. It makes my work much more efficient.
Other useful Features:
Though monitoring is the most important feature of ‘nmon’, it performs many other functions too! Let’s take you some of their other benefits.
Get The Top Process Details
You can get all the details of the top process running on your system. In order to get the top processes that are running currently, you should hit the ‘t‘ key on the keyboard of the system that you are using. The terminal will display the top processes, as shown in the screenshot given below:
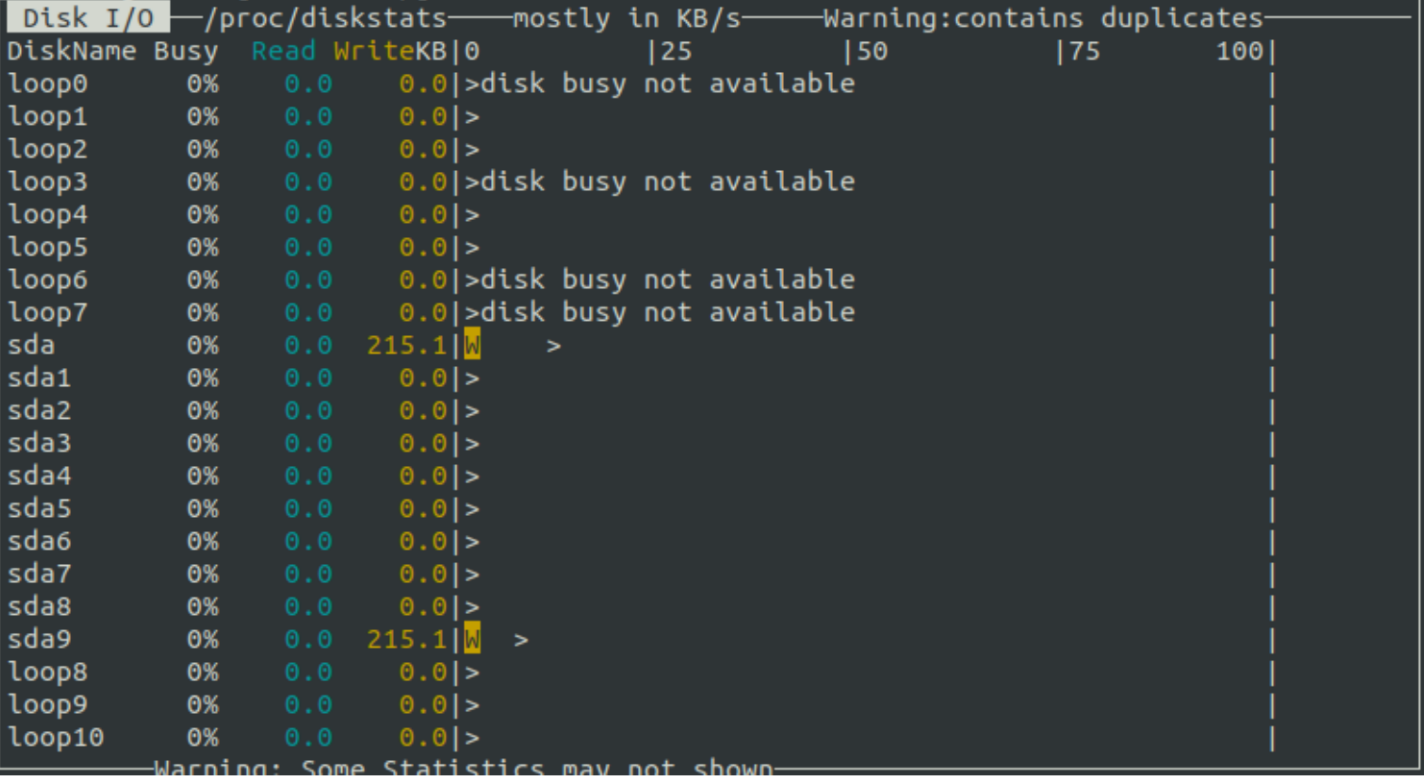
Disk I/O Graphs
In order to get information about disks, you should hit the ‘d‘ key on the keyboard of the system you are using. The disk data will be displayed on your screen as shown below:
Other Useful Tools Like ‘nmon’
As a developer, we keep hustling from one program to another. So, many times, one tool usually doesn’t suffice. In order to get the maximum benefits, you can try using a combination of tools. Some of the other useful tools are listed below.
- ‘top’
- VmStat – Virtual Memory Statistics
- Lsof – List Open Files
- Tcpdump – Network Packet Analyzer
- Netstat – Network Statistics
- Htop – Linux Process Monitoring
- Iotop – Monitor Linux Disk I/O
- IPTraf – Real-Time IP LAN Monitoring
Author Credit:
Before we say goodbye to you all, we must give credit where it’s due – this blog was written by Tanmaya Patra, Sr. Software Engineer of our Encoding Pod. The blog was edited by Debarpita Banerjee. We hope you enjoyed reading it!


Add your comment