Data plays a critical role in the success of any streaming business. Keeping track of content performance, user data, and revenue data helps you take the necessary steps to optimize your OTT business. And Muvi One’s Analytics module can help you immensely in this process!
Muvi One’s Analytics module is one of the most comprehensive and powerful BI modules a streaming business owner could ever have, delivering all the necessary business insights to your fingertips!
It provides all the relevant data about your content and revenue performance at a click of a button, helping you make accurate business decisions when it comes to monetizing and pricing strategy, marketing goals, or content planning.
You can use Muvi One Analytics to
- Get a quick overview of your platform and content performance in a specific time frame directly from the dashboard.
- Search content and get a quick summary of its performance.
- Analyze the user data to keep a track of their browsing behavior and content preferences.
- Keep track of the revenue generated by your platform.
- Download the report summaries for offline use.
- Adjust the dimensions, durations, and KPIs to match your business goals.
The table given below summarizes the dimensions and KPIs covered by Muvi One’s Analytics
KPIs | Dimensions |
Content | User | Device Type | Geography |
Views | ✔ | ✔ | ✔ | ✔ |
Watch Duration | ✔ | ✔ | ✔ | ✔ |
Revenue | ⛌ | ✔ | ✔ | ✔ |
Registered Users | ✔ | ⛌ | ✔ | ✔ |
Paid Users | ✔ | ⛌ | ✔ | ✔ |
In this blog, we will take a look at all the exciting features of Muvi One Analytics, its advantages, and then will take you on a quick ride of the analytics section of Muvi One. So, let’s begin!
Top Features of Muvi One’s Analytics
Muvi One’s Analytics module packs every single piece of information you would like to know about your platform’s performance and your users, within a very neat and clean easy-to-use interface. Let’s take you through some of the major features of this module.
Analytics Widget Directly on Your Dashboard
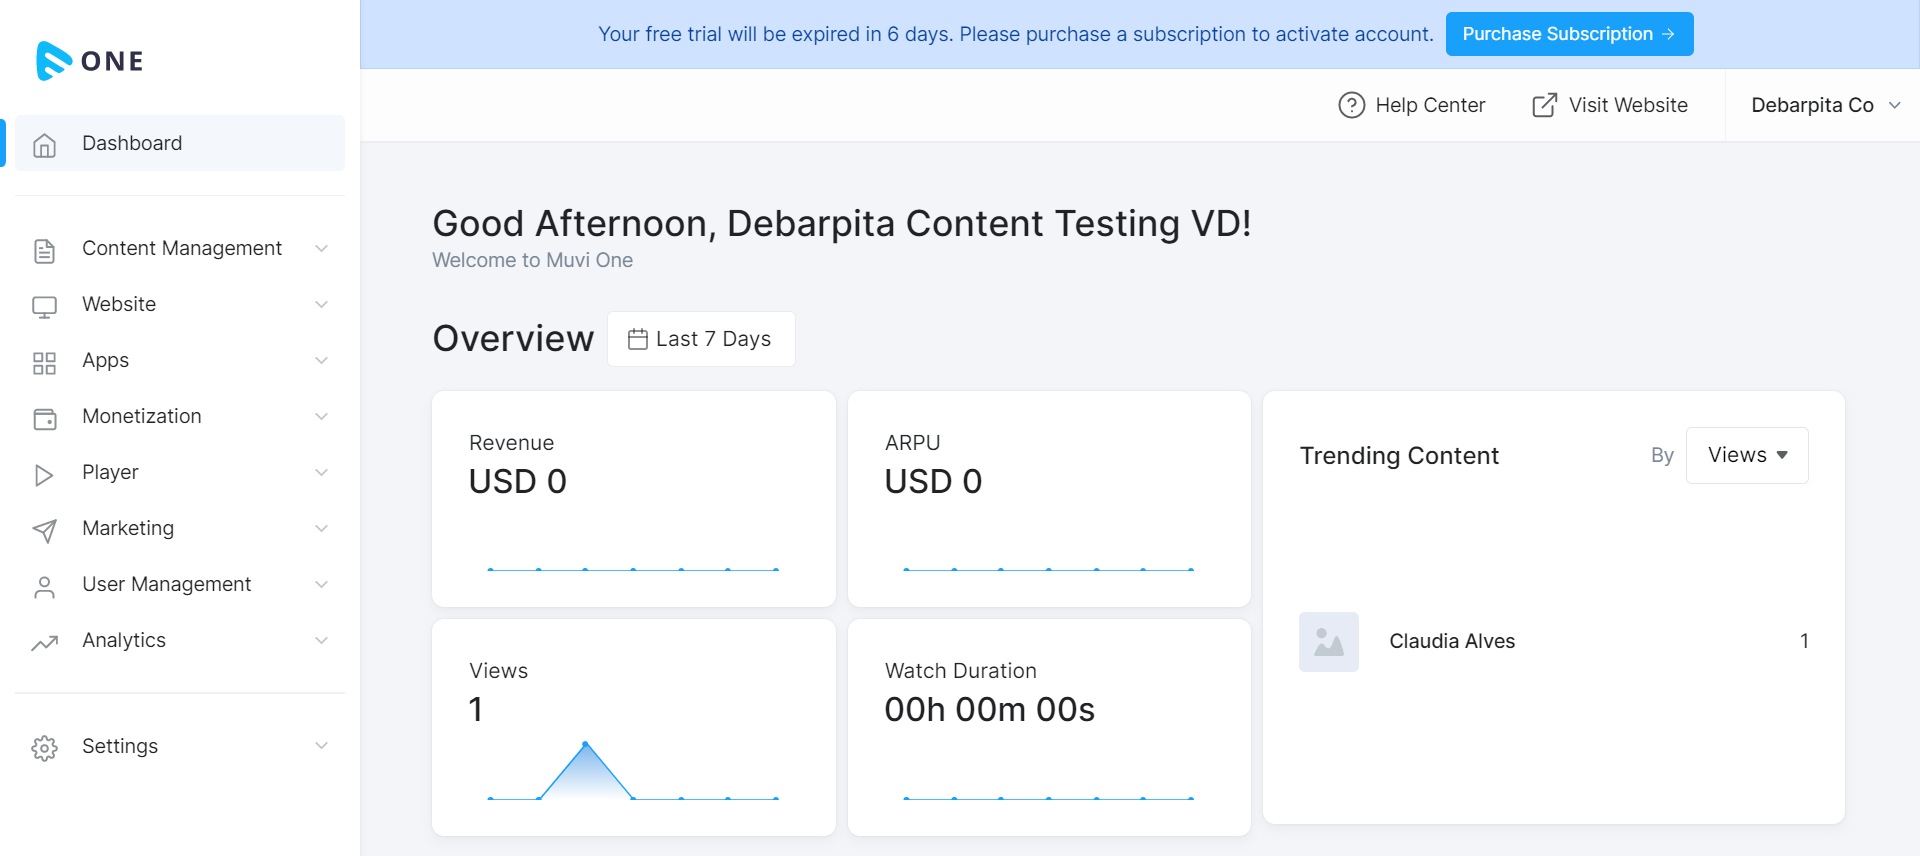
You don’t need to open a lot of pages to have a quick look at your platform’s overall performance. In fact, you will get a quick overview of the number of views, watch duration, and revenue generated by your platform directly from your dashboard, as soon as you log in to Muvi One CMS. And if you want to view the reports in detail, you can go to the analytics page.
Analyze KPI Trends For Chosen Duration
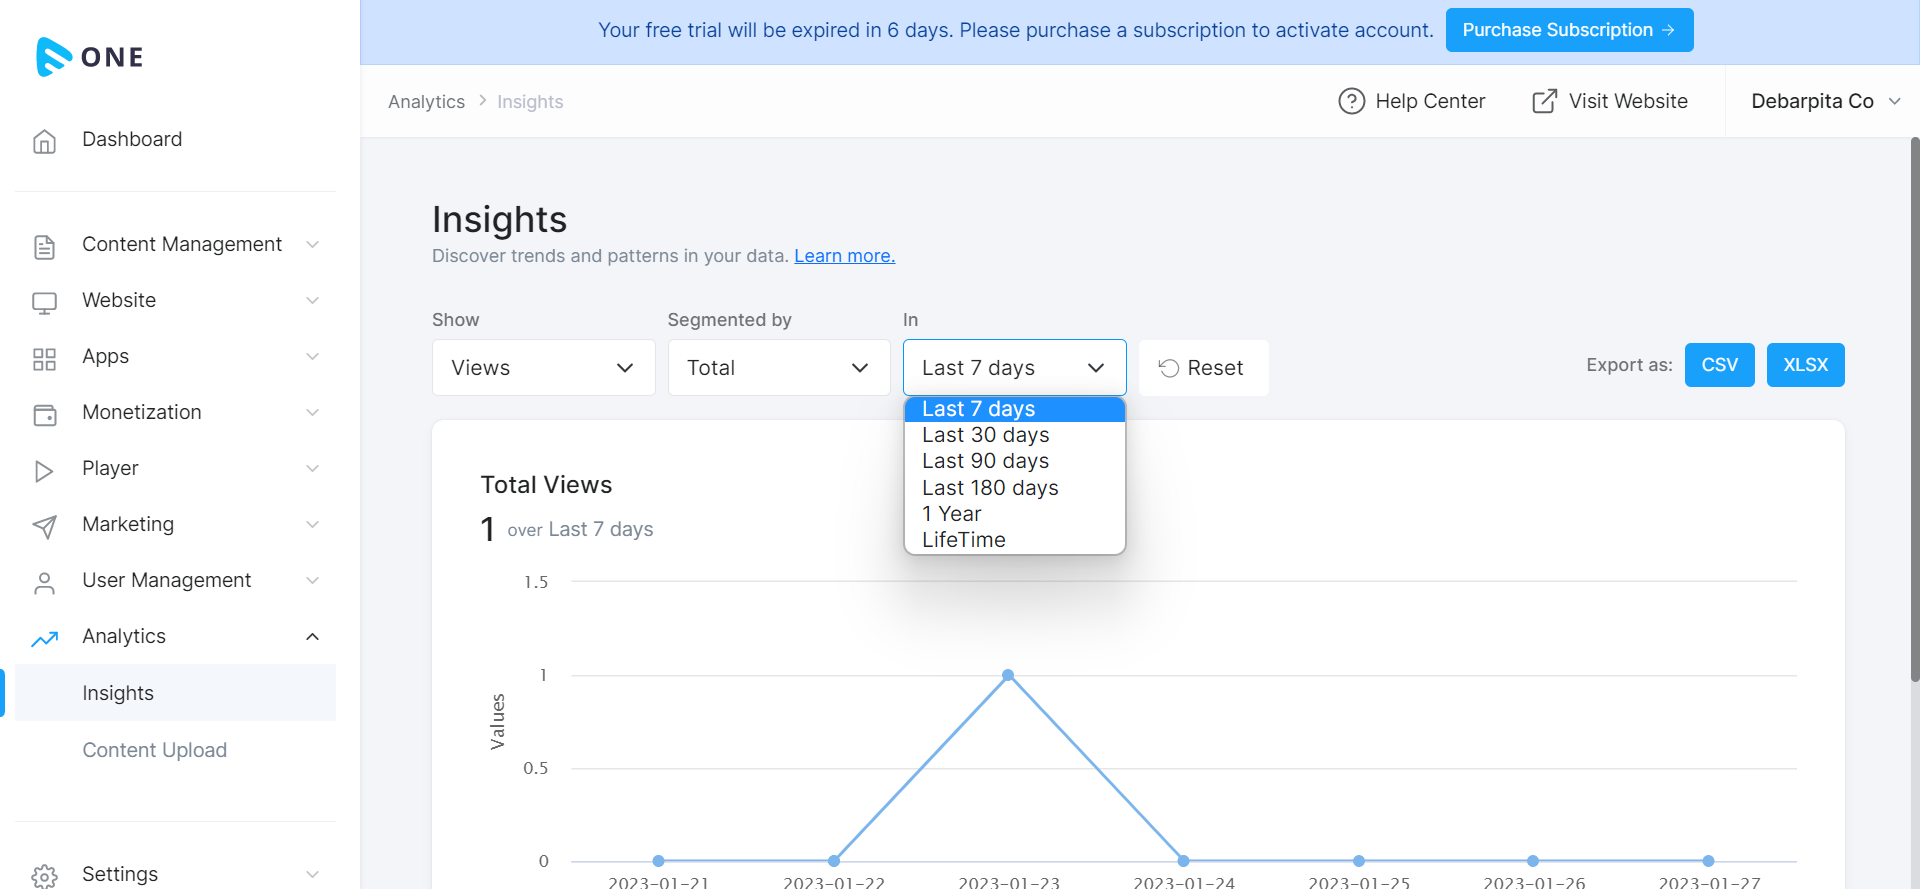
You can decide the duration for which you want to see the analytics report. You will get to choose from a list of multiple duration options like
- Last 7 days
- Last 30 days
- Last 90 days
- Last 180 days
- Last 1 year
- Lifetime
Choose a duration that fulfills your business goals!
Analyze Content Performance Dimension-wise
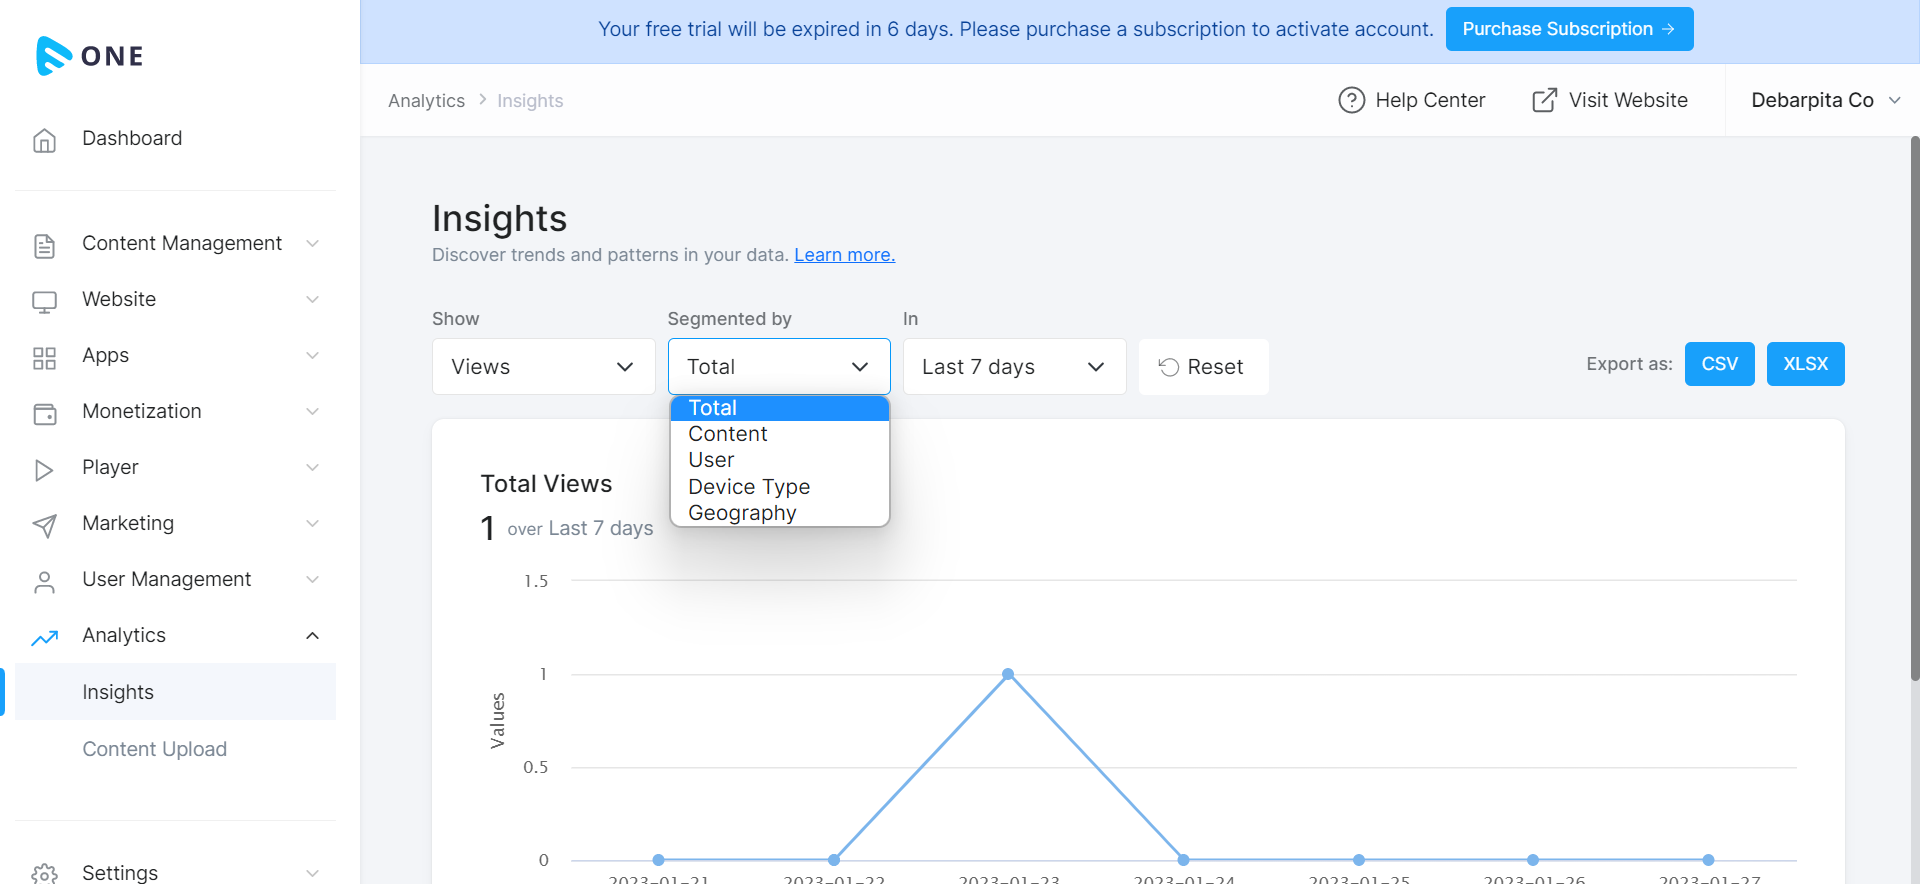
At Muvi One’s Analytics module, you can get detailed dimension-wise insights, on multiple dimensions like content, user, device type, and geography.
Search and Download Reports
You can search for specific data based on your content name, country name, or any other parameter name from the summary table. You can also download the entire data in the form of CSV and XLSX files for multi-purpose usage.
Efficient Data Logging, Processing, and Extraction Frameworks
Muvi One follows a very efficient data logging and processing framework, ensuring 100% accurate real-time data. We have also set up a very comprehensive data extraction setup, giving you a smooth ride in the entire process.
All Insights at a Single Page
The entire data is available on our Analytics page. You don’t need to go to separate pages to track separate KPIs. Just select and change the KPIs from the drag-and-drop menu and get the data in the same place. The graphical representation of data ensures enhanced comprehension and faster analysis.
Integrate Google Analytics
You can integrate Google Analytics with Muvi One Analytics, to get the most comprehensive analysis of platform performance. Track real-time content views effortlessly with integrated Muvi One Analytics.
Track User Behaviour
You can track the browsing behavior of your users, keep track of their views, watch duration, revenue generated for your platform, and more!
Analyze Content Performance
You can track the performance of each and every piece of content individually, over a specific period of time. You can also analyze the watch duration of that content.
Business Advantages of Muvi One’s Analytics
Muvi One’s Analytics empowers OTT business owners to take the right business decisions, by leveraging the most accurate business performance data. The easy-to-use analytics module comes with clean UI/UX for clutter-free analysis.
Let’s take you through some of the significant business advantages of using Muvi One’s Analytics module.
Get a Business Overview Directly From the Dashboard
Many times you need a quick outlook on your business within minutes. Keeping it in mind, we have added an analytics widget directly on our dashboard. It will help you take a quick note of the revenues and content views during conferences and calls when you don’t have enough time to open the analytics page.
Track Your Business Growth Over Time
Our analytics page lets you decide the time for which you want to track your platform performance. Hence, you can track business growth time-wise, and see which time factors, like a specific month or time of the year, are showing good trends for the specific type of content. Accordingly, you can schedule the launch of your content.
Identify the Content That’s Working
The content-wise view of the analytics page lets you identify the content that is trending, the content that has got the highest number of views with good watch duration. It helps you understand the concepts that are being liked by your customers. Hence, you can plan more content based on similar concepts in the future.
Identify the Most Loyal Users
You can view which user is viewing your content, and identify the users who spend the maximum time on your platform. It will help you keep track of the consumer base that remains loyal to your platform.
Identify Low-Performing Content and Work on Them
You can also identify the content which is not performing well. You can try to improve the quality of their upcoming episodes and seasons. You can also try promoting those content to attract viewers and generate views.
Identify The Priority Geographies & Localize Your Content
In Muvi One Analytics, you can analyze the content performance based on geographies too. It will help you identify the countries and regions where your content has a good fan following. You can then take further measures to increase your business in those geographies like you can localize your content to cater to a larger set of audience in that region.
A Quick Ride To Muvi One’s Analytics
In this section, we will give a quick preview of Muvi One’s Analytics module. So, let’s begin.
Going to Analytics
You can enter the analytics page from the CMS Dashboard. Expand the Analytics menu, and click on Insights, to enter the analytics page.
Total Number of Views
For getting view-wise data set the “Show” option to “Views”. A viewership graph will appear as shown below.
Watch Duration
You can shift to the watch duration-based data, by changing the “Show” option to “Watch Duration”.
Insights by Geography
Set the “Segmented By” menu to “Geography”, and have a detailed overview of the geography-wise analysis of platform performance.
Insights by Device Type
You can see the type of devices used to browse your content, by setting the “Segmented By” menu to “Device Type”.
Reach New Business Milestones With Muvi One Analytics
Muvi One Analytics empowers you to make data-driven business decisions, after analyzing all the factors that influence your content performance. Decide the type of content to curate, the languages that need to be focused on, and the devices where you need to expand your presence, to reach a larger consumer base. Along with Analytics, Muvi One is packed with 100+ industry-leading features like multi-DRm security, built-in CDN for reduced latency, a Visual Designer to curate unique OTT platforms and apps, and more! Enjoy maximum flexibility with multiple monetization models and multiple payment gateways. Sign-up to start your 14-day free trial today!


Add your comment