Analytics & Reports
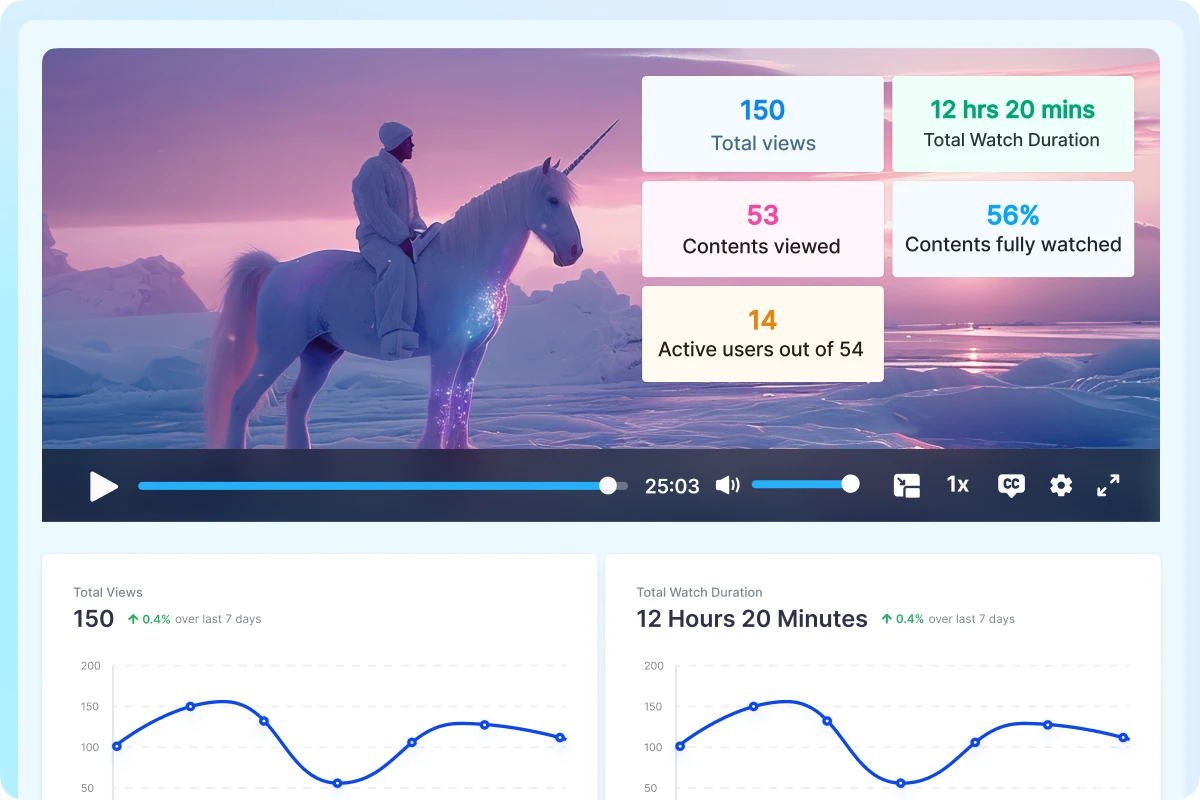
Track the live stream performance of your video content
Easily Integrate with BI Tools
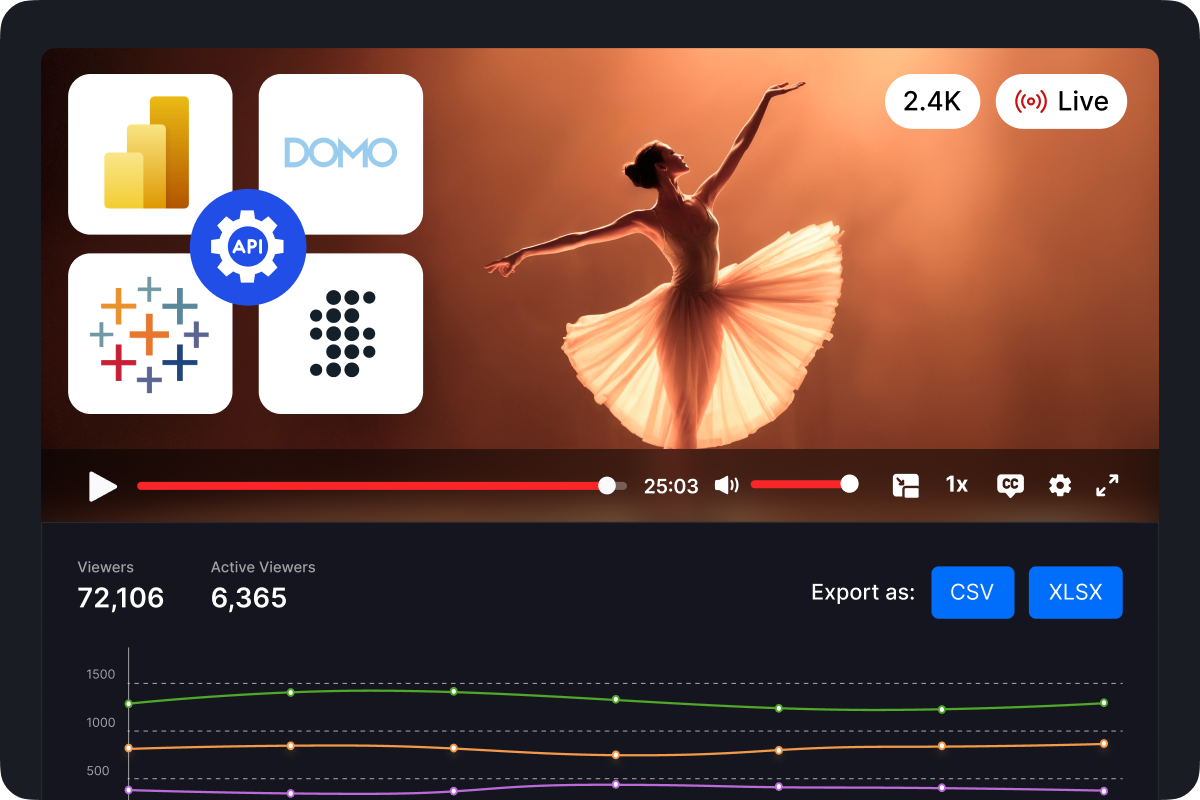
Seamlessly connect your BI tools with our robust APIs. You can also export data and reports as CSV or XLSX files from Muvi Live and import them into your BI tools to generate comprehensive reports.
- Monitor live event performance with viewer counts
- Track engagement duration and optimise performance
- Analyse revenue streams and audience heatmaps
Access Key Information for Specific Events
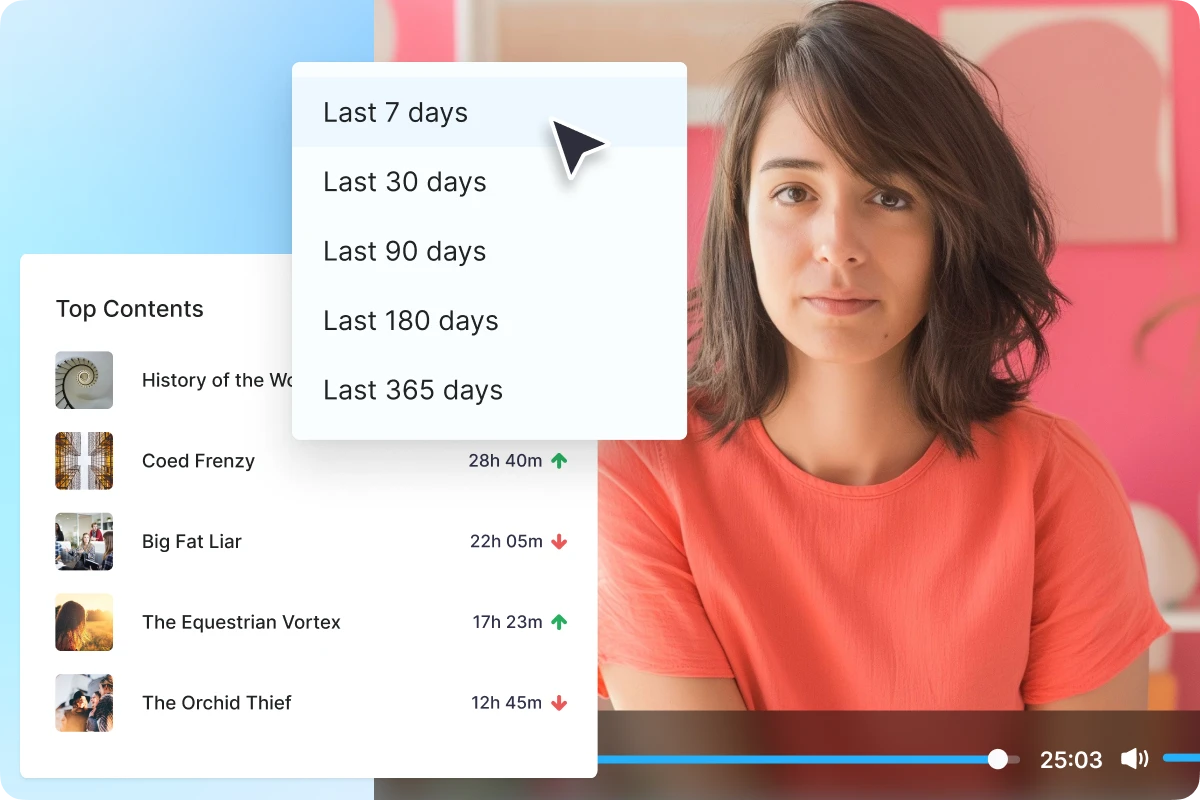
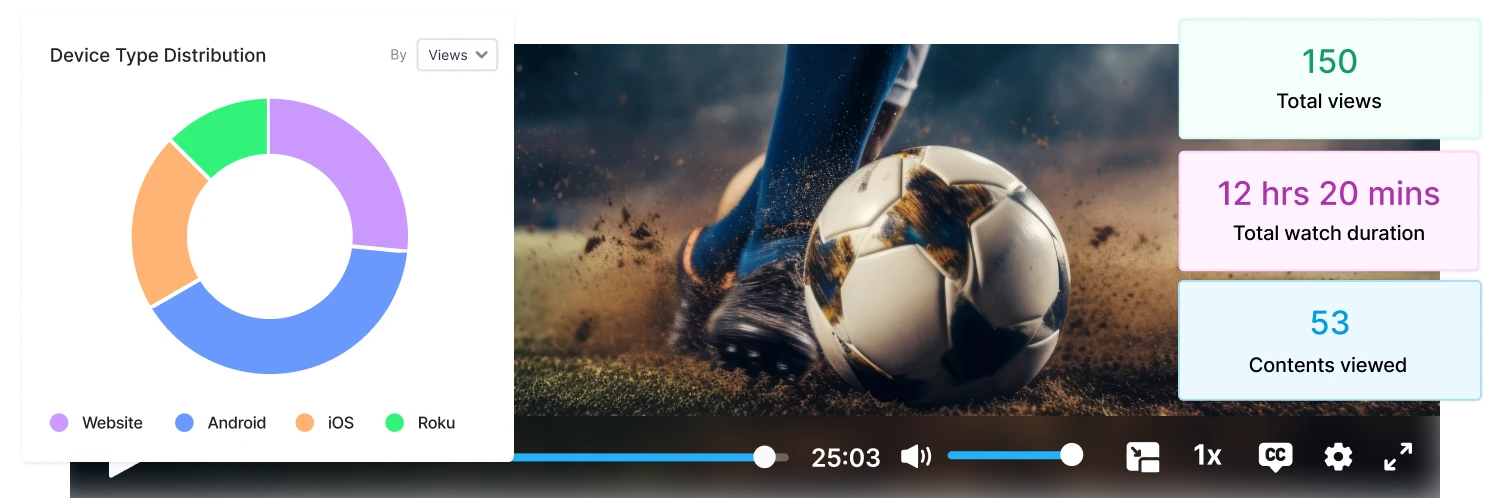
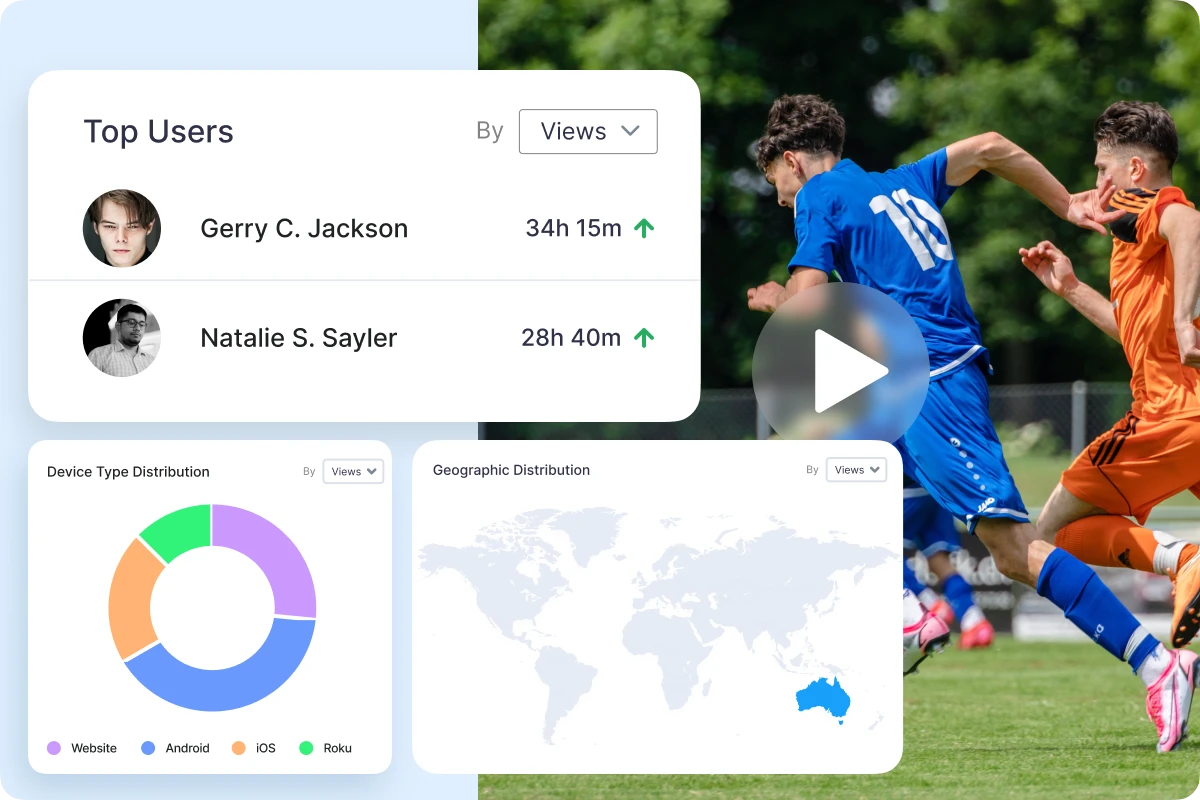
Gain comprehensive insights for up to a year on specific events, including detailed attendee information, geographical data, and device usage. Understand your attendees, where they are from, and how they access your content. Enhance your planning and execution for future events with this valuable information.
Historical User Analytics
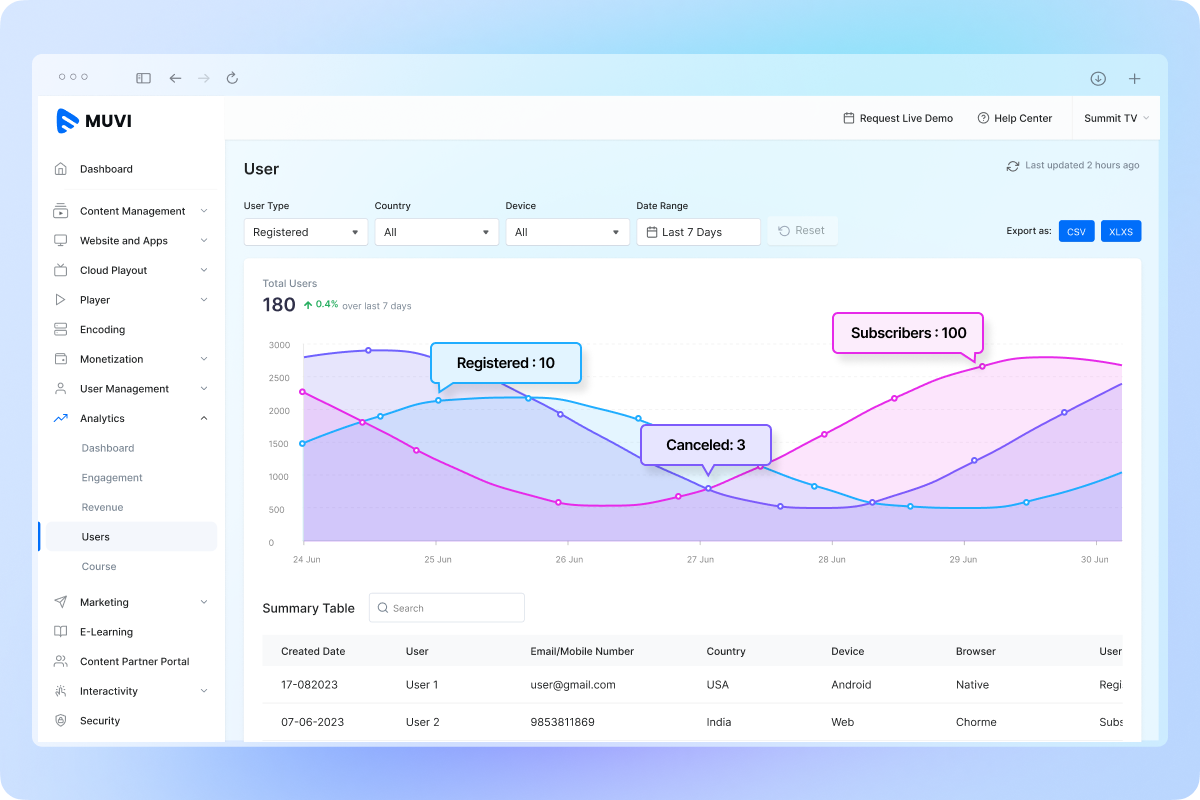
Go beyond current user activity and analyze how users move across your platform over time. Track historical data for different user types such as registered users, subscribers, PPV users, and cancelled users to better understand conversions, one-time purchases, and churn trends.
- See how many users cancelled during a specific period
- Track which users became subscribers in the last week
- Analyze one-time purchases made over time
- Measure subscription purchases during campaigns
The Right View for Your Data
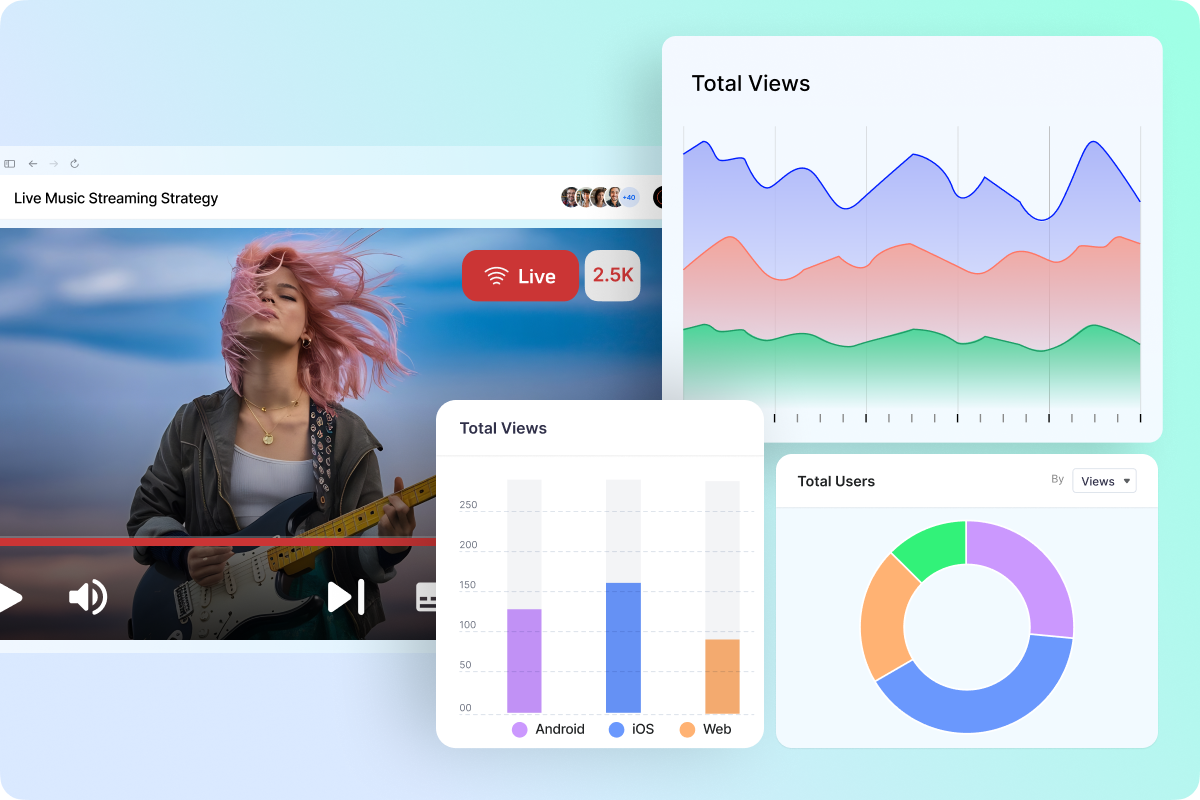
Choose the chart that best fits your data, whether you're tracking trends, comparing categories, or understanding audience distribution.
- Line Chart: Track trends over time, such as watch time or revenue
- Bar Chart: Compare values across categories, such as devices or content
- Column Chart: Compare values across time-bound segments, such as weekly views
- Pie Chart: See how a total is distributed, such as viewership by genre
- Area Chart: Track trends while showing overall volume, such as total watch hours