Every OTT platform generates a staggering amount of data — every play, pause, skip, login, cancellation, and purchase leaves a trail. The problem for most streaming businesses isn’t a lack of data. It’s that the data lives inside the platform’s own analytics dashboard, disconnected from the BI tools your finance, product, and leadership teams already use to make decisions.
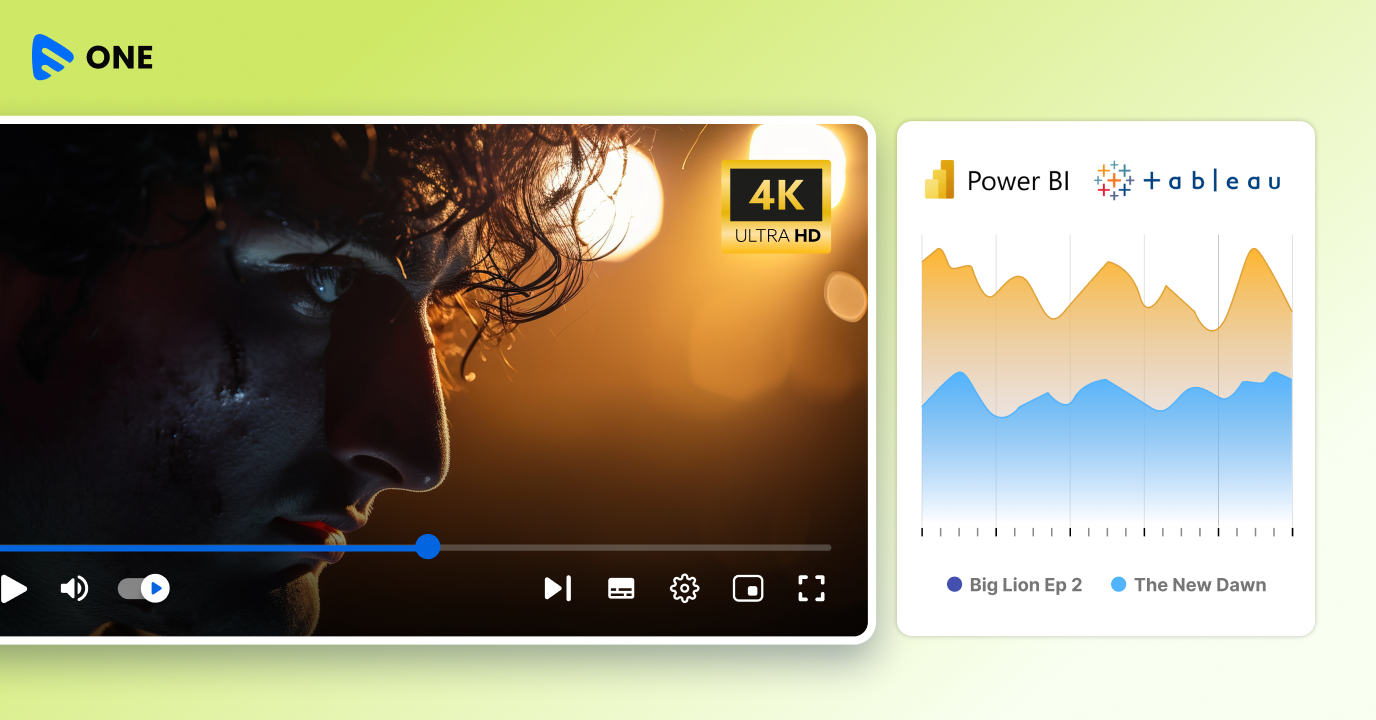
That gap is where OTT analytics integration earns its keep. Instead of exporting numbers manually every week or asking an engineer to pull a custom report, you connect your streaming platform directly to the business intelligence tools your organization already runs on — Power BI, Tableau, or similar — and let your existing dashboards pull in live streaming data alongside your other business metrics.
Muvi One is built to make this connection genuinely easy, not a multi-week integration project. This post walks through what that looks like in practice: what data is available, how the connection actually works, and what you can build once your streaming metrics sit next to the rest of your business intelligence.
Why OTT Platforms Need BI Beyond the Built-In Dashboard
A native analytics dashboard is useful for a quick pulse check — today’s active users, this week’s top titles, this month’s revenue. But it’s rarely where real business decisions get made. Those decisions usually happen in a BI tool that’s already pulling in data from your CRM, your ad platform, your finance system, and half a dozen other sources.
If your streaming data can’t sit alongside that data, you end up with two separate pictures of the same business: one for content and viewership, and one for everything else. Someone has to manually stitch them together, usually in a spreadsheet, usually once a month, usually a few weeks out of date by the time anyone looks at it.
OTT analytics integration closes that gap. When your streaming platform connects directly to Power BI or Tableau, viewership and revenue data become just another data source feeding the same dashboards your leadership team already trusts — no manual exports, no stitching, no lag.
The Data Muvi One Already Tracks
Before integration is useful, it helps to know what’s actually available to pull. Muvi One’s analytics layer already tracks the metrics most OTT businesses build their BI reporting around:
- Views, watch time, and completion rates across your content library
- Content performance segmented by demographics and subscription tier
- User logins, watch activity, and cancellation patterns for churn analysis
- Revenue performance across plans, content, regions, and content partners
None of this is new data you have to instrument yourself — it’s already being collected as part of how Muvi One runs your platform. What OTT analytics integration adds is a clean, structured path to get that data out and into the tools where the rest of your business intelligence already lives.
Learn more: Muvi One Analytics & Reports
How the Integration Actually Works
This is the part that surprises most teams: connecting Muvi One to a BI tool doesn’t require a development sprint or a data engineer on standby. There are two ways to do it, and the right one depends on how real-time you need your reporting to be.
Export and import. Pull data and reports straight out of Muvi One as CSV or XLSX files, then bring them into Power BI, Tableau, or whichever BI tool your team runs. This is the fastest path for teams that want to slice and dice segmented KPIs without setting up a live connection — useful for periodic reporting, board decks, or one-off deep dives into a specific metric.
API-based sync. For teams that want their BI dashboards updating automatically, Muvi One’s APIs sync your analytics and platform data directly with leading BI tools — Power BI, Tableau, Domo, Sisense, and others. Once it’s set up, your BI dashboards stay current without anyone manually re-exporting anything. This is the option most growing platforms move toward once they’re relying on BI dashboards for regular, not occasional, decision-making.
Either path gets you to the same place: a centralized view of your KPIs, sitting in the same tool your team already uses to look at the rest of the business.
Read More: Muvi One BI Tools
What You Can Build Once You’re Connected
Once your streaming data is flowing into Power BI or Tableau, the real value shows up in what you can build on top of it. A few examples that come up often:
Churn prediction dashboards. Combine login frequency, watch activity, and cancellation history to flag at-risk subscribers before they churn, rather than explaining the drop after it’s already shown up in your revenue numbers.
Content performance by segment. Cross-reference watch time and completion rates against demographics and subscription tier to see which titles are actually driving retention for which audience — not just which titles have the highest raw view counts.
Revenue forecasting across dimensions. Build predictive views of revenue across plans, content categories, regions, or content partners, using historical patterns instead of a flat month-over-month projection.
Personalized engagement tracking. Follow a subscriber’s activity across their full lifecycle — from signup through active viewing to renewal or cancellation — to identify where engagement drops and where it’s working.
Geography-informed content planning. Use regional viewership and revenue data to build a distribution plan that’s backed by where your content is actually performing, rather than where you assume it should.
None of these require rebuilding your BI setup. They’re standard BI-tool capabilities — cohort analysis, predictive modeling, cross-filtering — applied to streaming data that’s now sitting in the same place as the rest of your business metrics.
The BI Tools Muvi One Connects To
Muvi One’s integration isn’t built around a single vendor. It’s designed to work with the BI tools OTT businesses are already standardized on:
Power BI — a natural fit if your finance or ops teams already run Microsoft’s ecosystem
Tableau — strong for teams that lean on visual, exploratory analysis across large datasets
Domo — useful for organizations that want a fully cloud-based, real-time BI layer
Sisense — geared toward teams embedding analytics directly into other internal tools or products
Because the connection runs through standard exports and APIs rather than a proprietary format, it isn’t a one-tool decision. If your organization changes BI tools down the line, the underlying data pipeline doesn’t need to be rebuilt from scratch.
Third-party BI integration is available on Muvi One’s Professional plan and above, alongside advanced analytics filters and segments. Higher tiers add extensions like custom analytics reports and longer analytics history, which matter more once you’re building recurring executive dashboards rather than pulling reports occasionally.
In practice, this feature earns its place once a platform has outgrown checking the native dashboard a few times a week and started treating streaming data as a regular input into company-wide reporting — a point most platforms reach well before they need enterprise-tier infrastructure.
Getting Started
Setting up BI integration on Muvi One typically comes down to a few steps:
- Decide on export or API sync based on how current your dashboards need to be
- Identify the KPIs that matter most to the teams who’ll actually use the dashboard — content, finance, and growth teams often want different views of the same underlying data
- Connect your BI tool using Muvi One’s export files or API credentials
- Build or extend existing dashboards rather than starting from scratch — streaming data slots in as another source alongside what your BI tool already pulls in
Most teams have a working connection and a first dashboard live well within a day, not a quarter-long integration project.
Final Comments
Muvi One is built so that connection doesn’t require a development project. Whether you export data directly or sync it live through the API, Power BI, Tableau, and other BI tools can be pulling in your streaming metrics the same day you set it up. Explore Muvi One’s BI integration to bring your streaming data into the same view, or start a free trial to see it working against your own analytics. Get a free 14-day trial to learn more.











Add your comment